A 2018 Model 3 Long Range, 105,000 miles on it. Two screenshots of the phone
app, six hours apart overnight, turn out to measure the battery more honestly
than any number the car displays.
Here is what they say. At 10:57 PM: 121 miles of range,
charging at 24 A and 234 V, 21 mi/hr, 27 miles added so far. At
5:08 AM: 246 miles, 153 added, and the current has fallen
to 12 A at 239 V even though the dial is still set to 24.
Four separate facts fall out of that pair, and only one of them is the charge
rate.
1. How big the battery actually is
At 5:08 the car reads 246 miles with 30 minutes left at 10 mi/hr, so a
full charge is about 251 rated miles. Tesla’s rated mile is a
fixed 242 Wh, which makes the usable pack:
251 mi × 242 Wh = 60.7 kWh
It left the factory with 75 kWh. That is 19% gone at 105,000
miles — noticeably worse than the 8–10% a Model 3 of that age
usually shows. Worth knowing, and worth knowing before planning a trip
around the number on the screen.
2. A rated mile is not a mile
The day before, the car ran Modesto to Livermore, Livermore to the Santa Cruz
Boardwalk, then down to the harbour — 138 real miles,
starting full. It plugged in showing 93 miles of range.
251 minus 93 is 158 rated miles consumed to cover 138 actual
miles. Every real mile cost 1.14 rated ones. In energy:
158 × 242 Wh = 38.2 kWh over 138 mi =
277 Wh/mi
So the honest range on a full pack, driven the way this car actually gets
driven, is 60.7 kWh ÷ 277 Wh/mi = 219 miles. The display
says 251. It is not lying; it is quoting the EPA’s 242 Wh/mi against a pack
it has measured. It simply has no idea how you drive.
3. Speed is the whole story
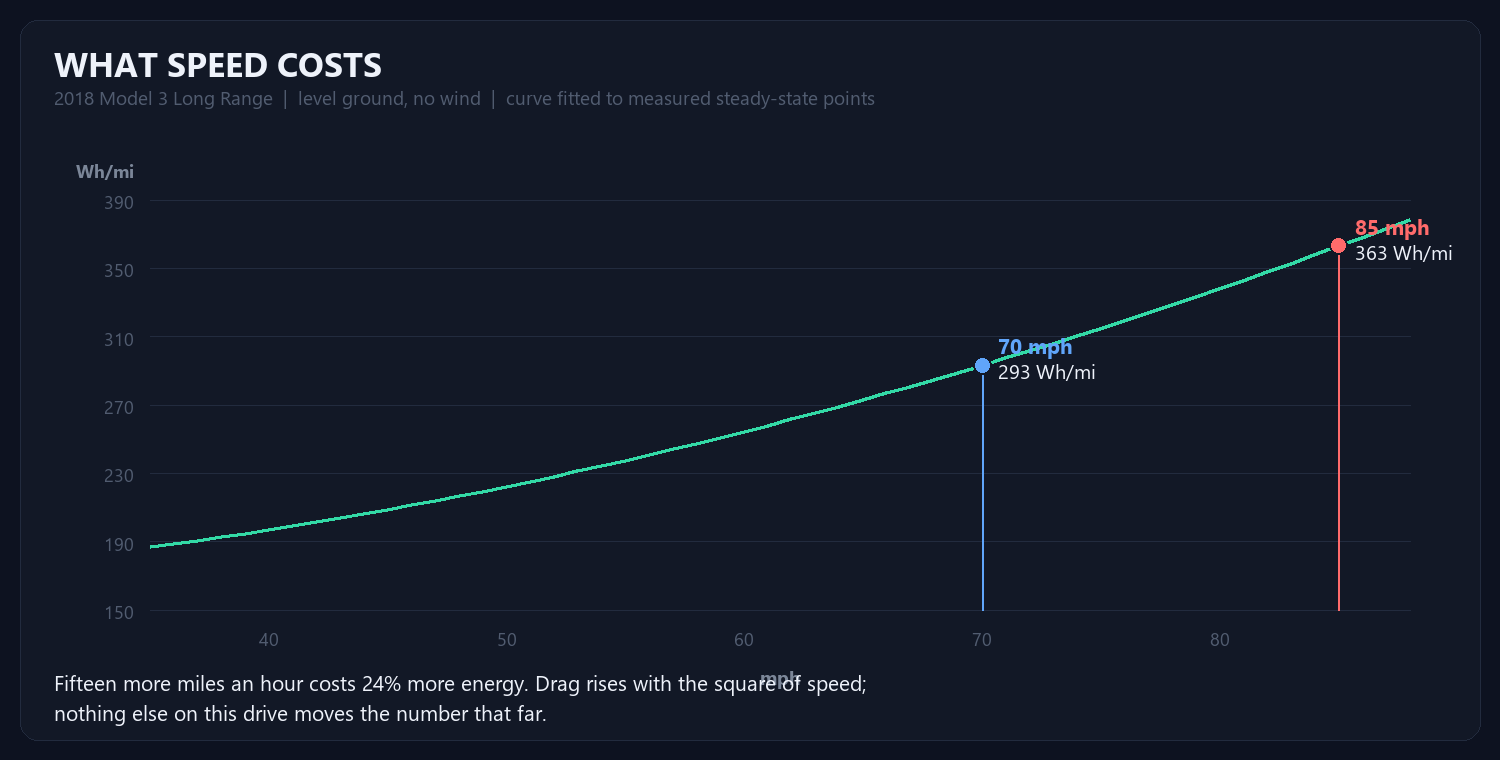
Aerodynamic drag rises with the square of speed, and the power to
overcome it with the cube. That one fact dominates everything else on a
freeway drive. Seventy miles an hour costs about 293 Wh/mi in this car.
Eighty-five costs 363. Fifteen extra miles an hour is 24% more
energy, and it is the only lever on the list that moves the number
that far.
4. Where a specific 60 miles goes
Santa Cruz harbour to San Carlos: up Highway 17 over the summit at
1,800 feet, down into Los Gatos, then 85 and 280 north at 70–85. Sixty
miles. Modelled segment by segment:
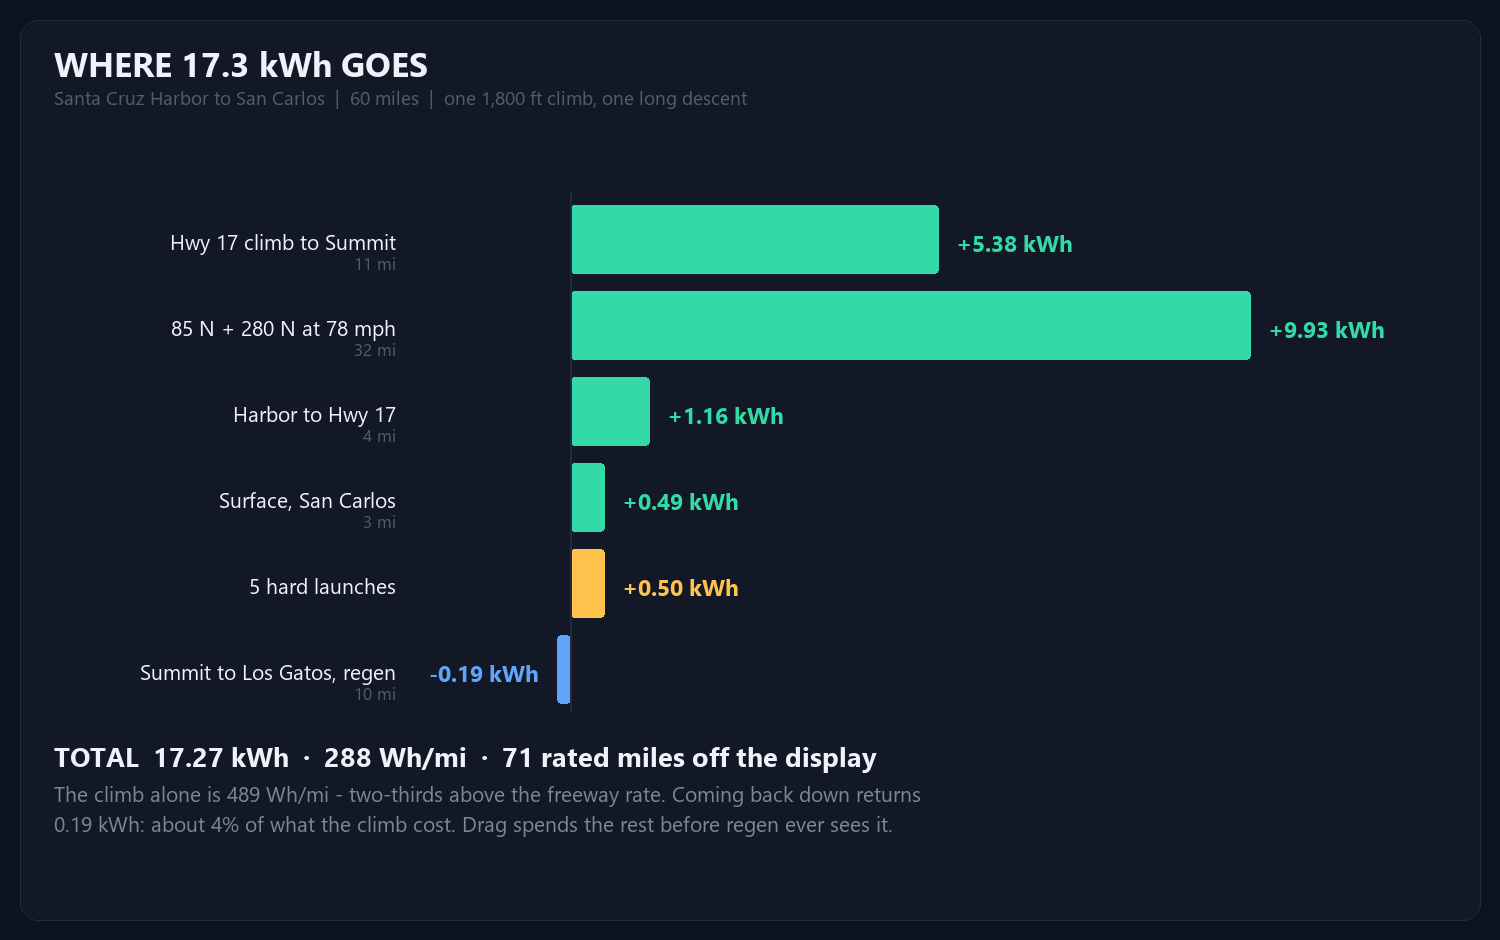
Two things in that ledger are worth arguing about.
The climb costs 489 Wh/mi — two-thirds more than the
freeway rate, because lifting 4,100 lb of car and driver 1,800 feet takes
about 3 kWh no matter how gently you do it.
And coming back down returns 0.19 kWh. About 4% of what the climb
cost. This is the part people get wrong. “Regen all the way down the
hill” sounds like a refund, and it isn’t one. At 60 mph, drag and rolling
resistance are already eating roughly 10.8 kW; gravity on that grade supplies
about 13 kW. Only the surplus reaches the motor, and only about 70%
of that survives the trip back into the battery. Regen’s real job is not to
refill the pack. It is to stop you spending, and to save the brakes.
The five hard launches cost 0.5 kWh between them —
two rated miles, about 3% of the drive. A full-throttle pull feels expensive and
is nearly free, because the kinetic energy you buy is energy you then get to use.
The penalty is just the efficiency of buying it in a hurry. Drive 85 instead of
70 and you will spend six times that much without noticing.
5. The cord, and what it quietly told us
Fifty feet of 10/4 SOOW, an L14-30 to 14-50 adapter, the car dialled down to
24 A. That is the right setting: 24 A is 80% of a 30 A circuit, which
is what continuous load is allowed to draw.
Ten-gauge copper is about 1 mΩ per foot, so fifty feet out and back is
0.1 Ω — 2.4 V of drop at 24 A, 1% of the
supply, 58 W warming the cable. Entirely fine.
But look at the two voltage readings. 239 V at 12 A,
234 V at 24 A. Five volts for twelve amps is
0.42 Ω of source impedance, and the cord only accounts
for a quarter of it. The other 0.32 Ω is upstream —
the supply itself sagging under load. Two numbers in a screenshot, and the
weakest link in the circuit identifies itself without a meter.
6. What the charge actually ran at
125 rated miles added between 10:57 PM and 5:08 AM — six hours
eleven minutes — is 20.2 rated miles per hour, or about
4.9 kW into the pack. Predicted from first principles: 24 A ×
234 V = 5.62 kW of AC, × 92% for the onboard charger =
5.2 kW, 21.4 rated mi/hr. The measured average comes in
just under because of the last hour.
That last hour is the 12 A reading. The dial still says 24. Nobody turned
it down — the car did, because it was at 98% and tapering, which is what
constant-voltage charging looks like from the outside. Reading that number as
“the circuit is weak” would have been exactly wrong.
Why 85%, and why not yet
The standing advice is to live between 20% and 80–85% and leave 100% for
trips, because lithium cells age faster held at a high state of charge. The
exception is calibration. The car does not measure state of charge directly; it
infers it, and that inference drifts. Charging to 100% and letting it rest gives
the BMS the top reference it needs, and a deep discharge gives it the bottom.
That is why this one went to 100% overnight: to find out whether 251 miles is
really what is left. Then back to 85% for daily use — and the honest
planning number from here is not 251, and not 219 either. It is 85% of
60.7 kWh at whatever speed you actually drive, which at 78 mph
on 280 is about 170 real miles.
Measure the thing. The dashboard is an opinion.
Consumption curve fitted to published steady-state measurements and
anchored against this car’s own two drives; grade energy computed from mass and
elevation, regen credited only on the surplus left after drag. The model
predicted 158 rated miles for the Modesto run. The car reported 158.