Saturday started at 5:25 in the morning with a dead laptop, a house battery at
5.8 percent, and both inverters missing from their own cloud. Sunday ended with
a sonar on top of a hill reporting gallons and gallons-per-minute, the battery
monitor on a wire updating once a second, both inverters answering over RS485,
and a wall display that a grandfather can read from across the room.
This is the long version of how that happened, including every wrong turn,
because the wrong turns are the useful part.
Where it started
The laptop that runs everything had lost wall power Friday evening and shut
itself down on a critical battery at 10:23 PM. When it came back at dawn,
this is what the wall looked like:
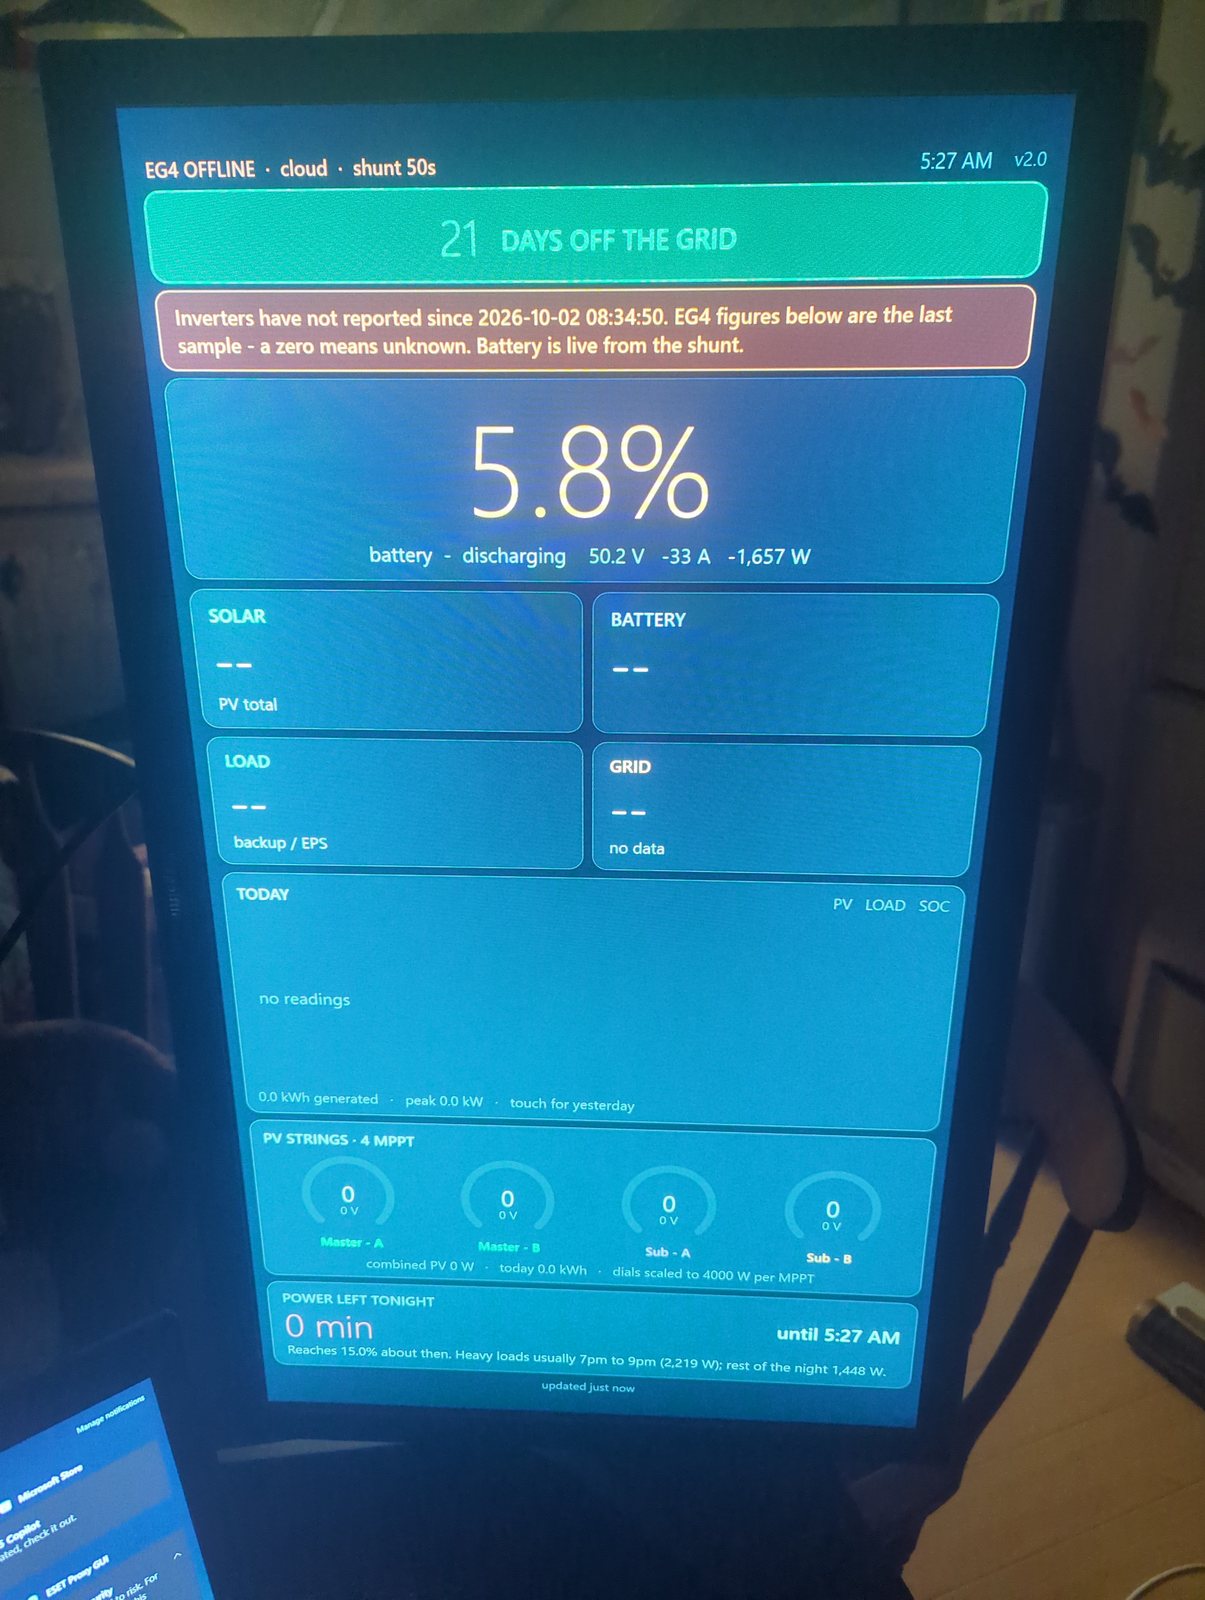
Version 2.0. A stack of cards, most of them dashes, because the inverters had
stopped reporting to the vendor’s cloud the morning before. The one live number
was the battery, from the Victron shunt, and it said 5.8 percent and falling at
1.7 kW. The “power left tonight” card said zero minutes, because it was
counting down to a 15 percent floor we had sailed through hours earlier.
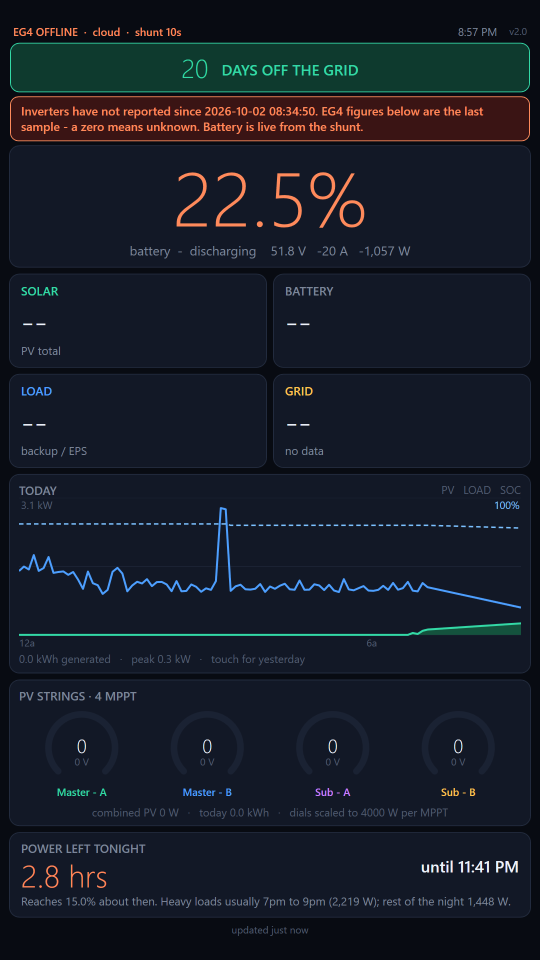
That screen had three problems that shaped the whole weekend. It depended on
two vendor clouds, so when either one hiccupped it went blank. It was slow: the
battery figure came from a database that only produced a new sample about every
105 seconds. And it told you nothing about water, which on a ranch is the other
thing you run out of.
The plan: move the operation to a second laptop that lives in the solar room,
wire that laptop directly to the equipment, and put a level sensor on the tanks
half a mile up the hill.
Two machines, passing notes
The work ran as two Claude Code sessions, one on the laptop that travels and
one on the laptop that stays, messaging each other over a Tailscale network.
One did the radio firmware, the phone app and the coordination. The other owned
the wall display and everything plugged into it. Most of what follows was
decided on a phone, standing next to whatever was being wired.
The radio link: three bugs before the first walk
The tank link is two Heltec LoRa boards. The one that goes up the hill got
named HILL, the one at the bottom BASE, and the name is printed in big letters
on each screen so they cannot be mixed up. The first firmware was a range
tester: HILL pings, BASE answers, both screens show signal strength in both
directions.
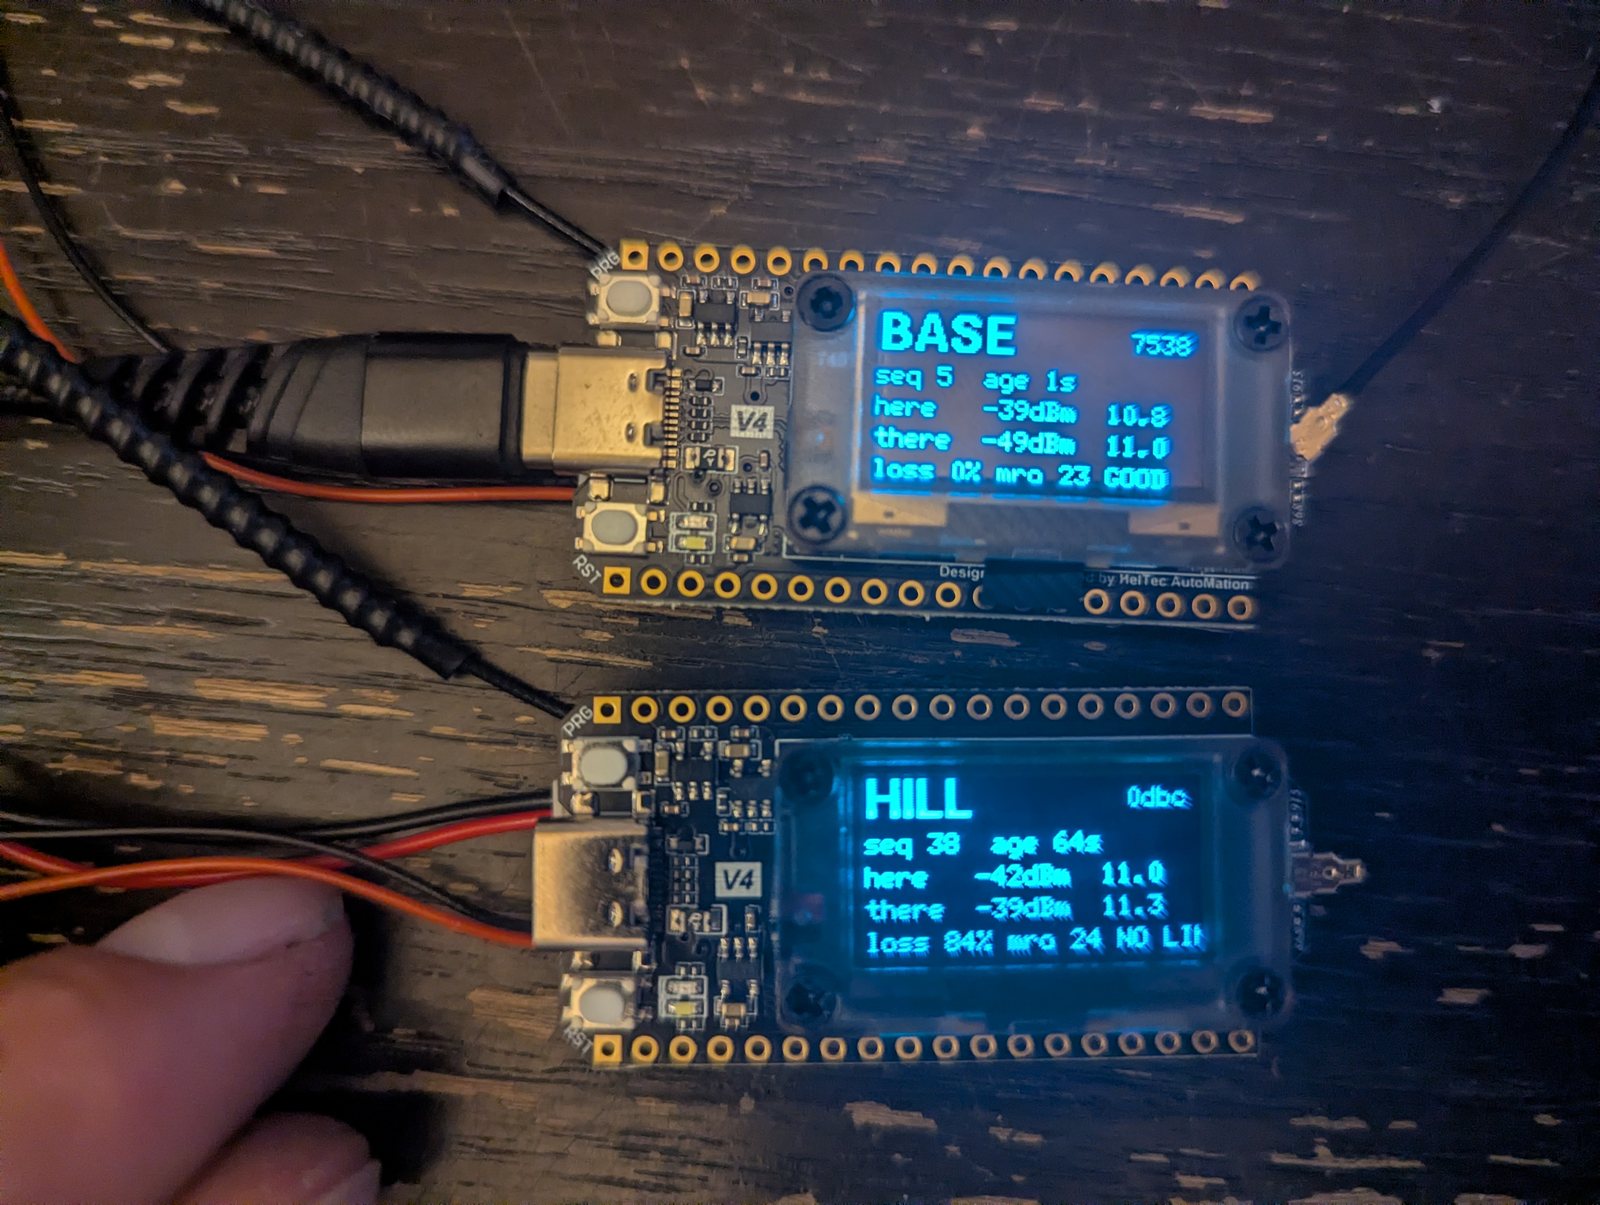
That photo caught the first real bug. BASE says GOOD, sequence 5, one second
old. HILL says sequence 38 and no link. BASE was frozen. With its USB cable
plugged in and nothing reading the log, the log buffer filled after six lines
and the board hung waiting to write. The fix was to drop a log line when the
buffer is full instead of waiting. The same photo shows the second bug: “NO
LINK” was two characters too wide for the screen.
Then the walk. It failed in the front yard.
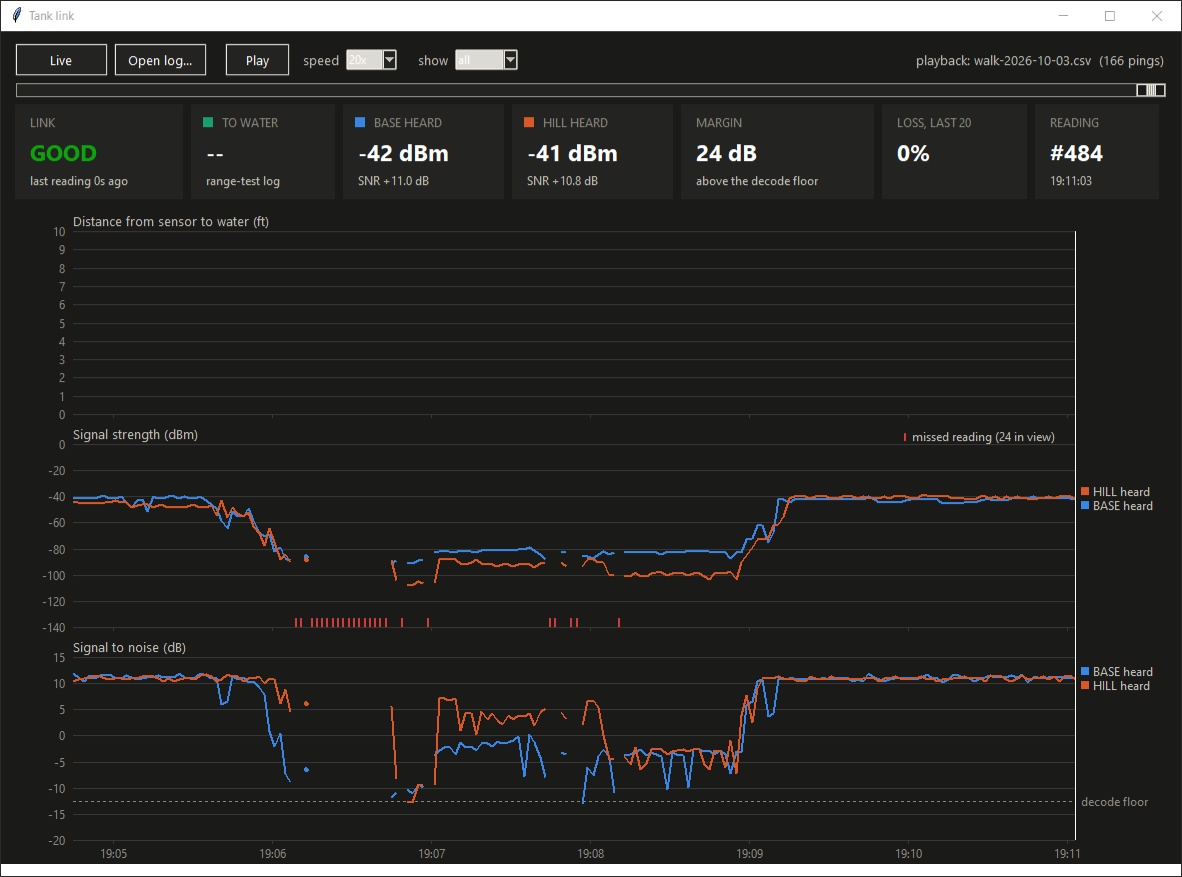
Fifteen pings missed in a row, through one wall and some Douglas fir. The
owner’s reaction was the right one: something is wrong. It was. These boards
come in two revisions with different radio amplifier chips, and on this revision
one control pin has to be flipped for every transmission. The firmware was
holding it in the receive position, so the amplifier never switched on and the
signal leaked out roughly 40 dB down, about a ten-thousandth of the intended
power. With the fix, the same two boards on the same desk went from -40 dBm
to about 0.
The next walk reached a quarter mile. Then a 40 minute drive around town with
the logger running:
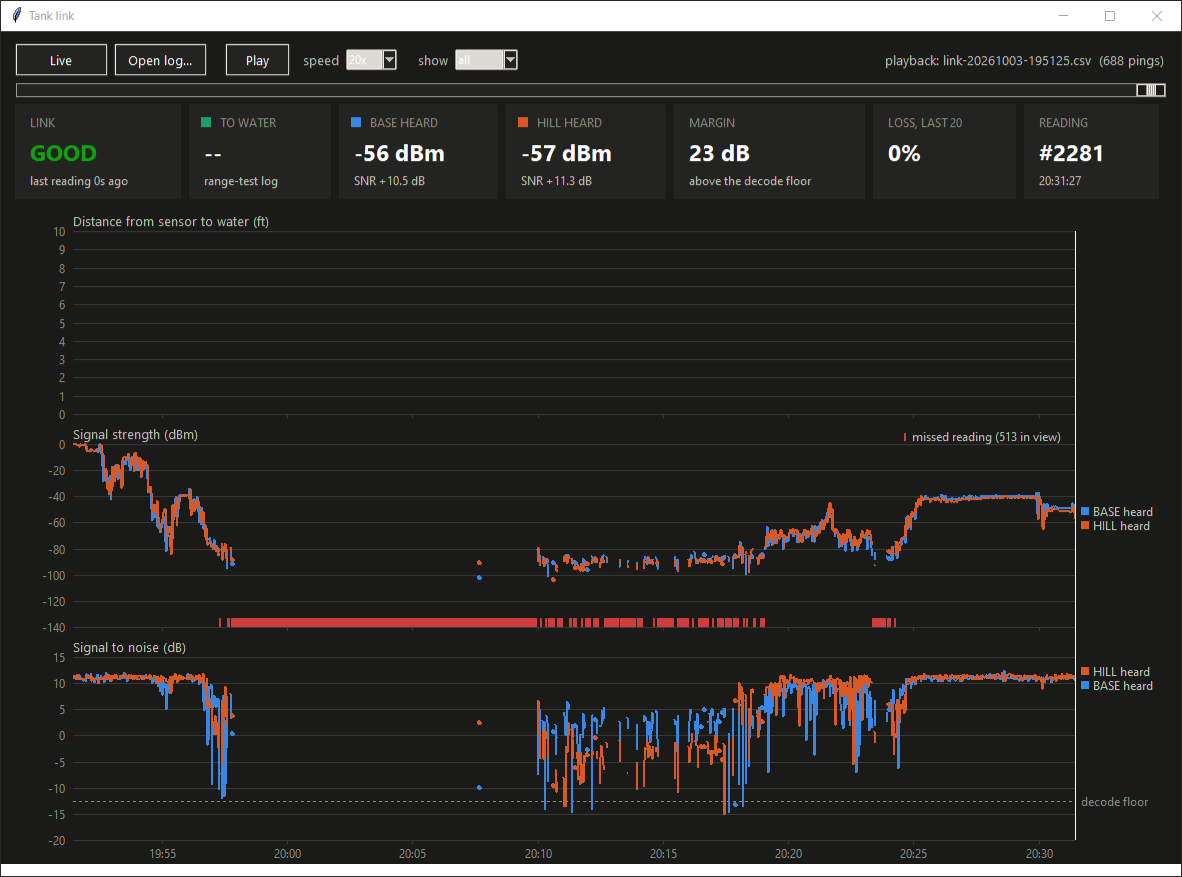
Solid out to about half a mile, a ten minute stretch of nothing at the far
end, and a clean recovery on the way back. One calibration came out of that
chart: on these boards a receive amplifier sits ahead of the measurement, so the
signal figure reads about 20 dB high. The link dies near -100 on the screen,
not the -125 you would expect from the radio chip alone. Signal-to-noise is the number
to trust.
The sonar: which hole is hole 6
The level sensor is a waterproof ultrasonic module, the kind used for parking
sensors. It runs from a switched 3.3 volt pin on the board, which matters
more than it sounds: the module idles at about 5 mA, and left on all day that
would be several times the rest of the power budget combined. Switched, it draws
nothing between readings.
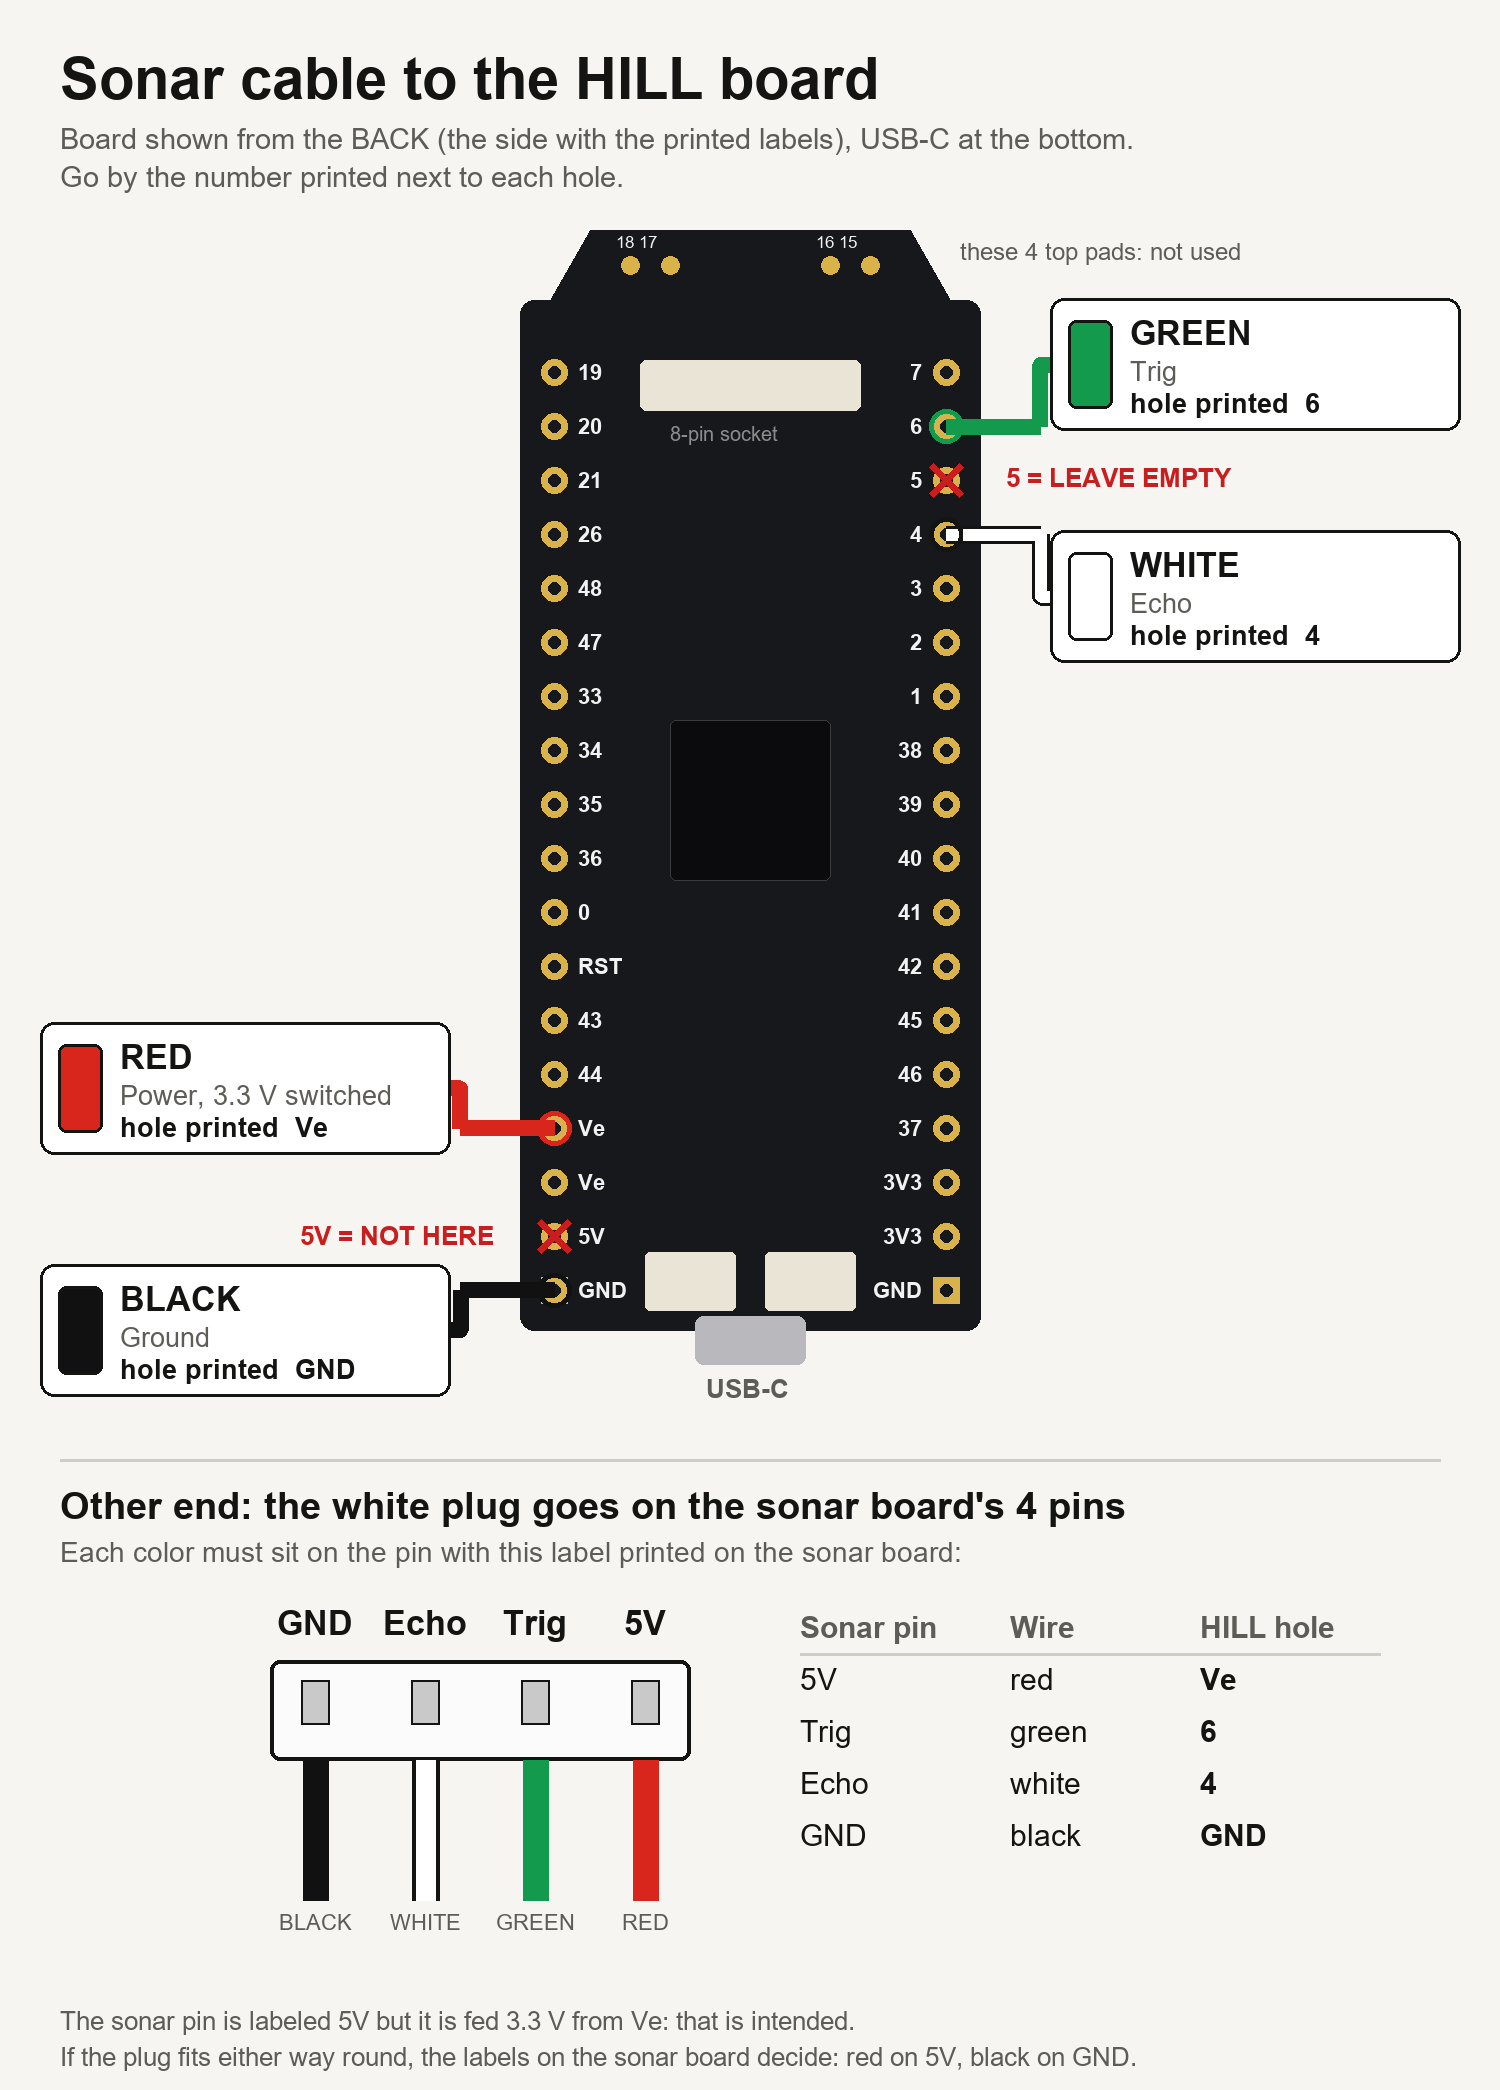
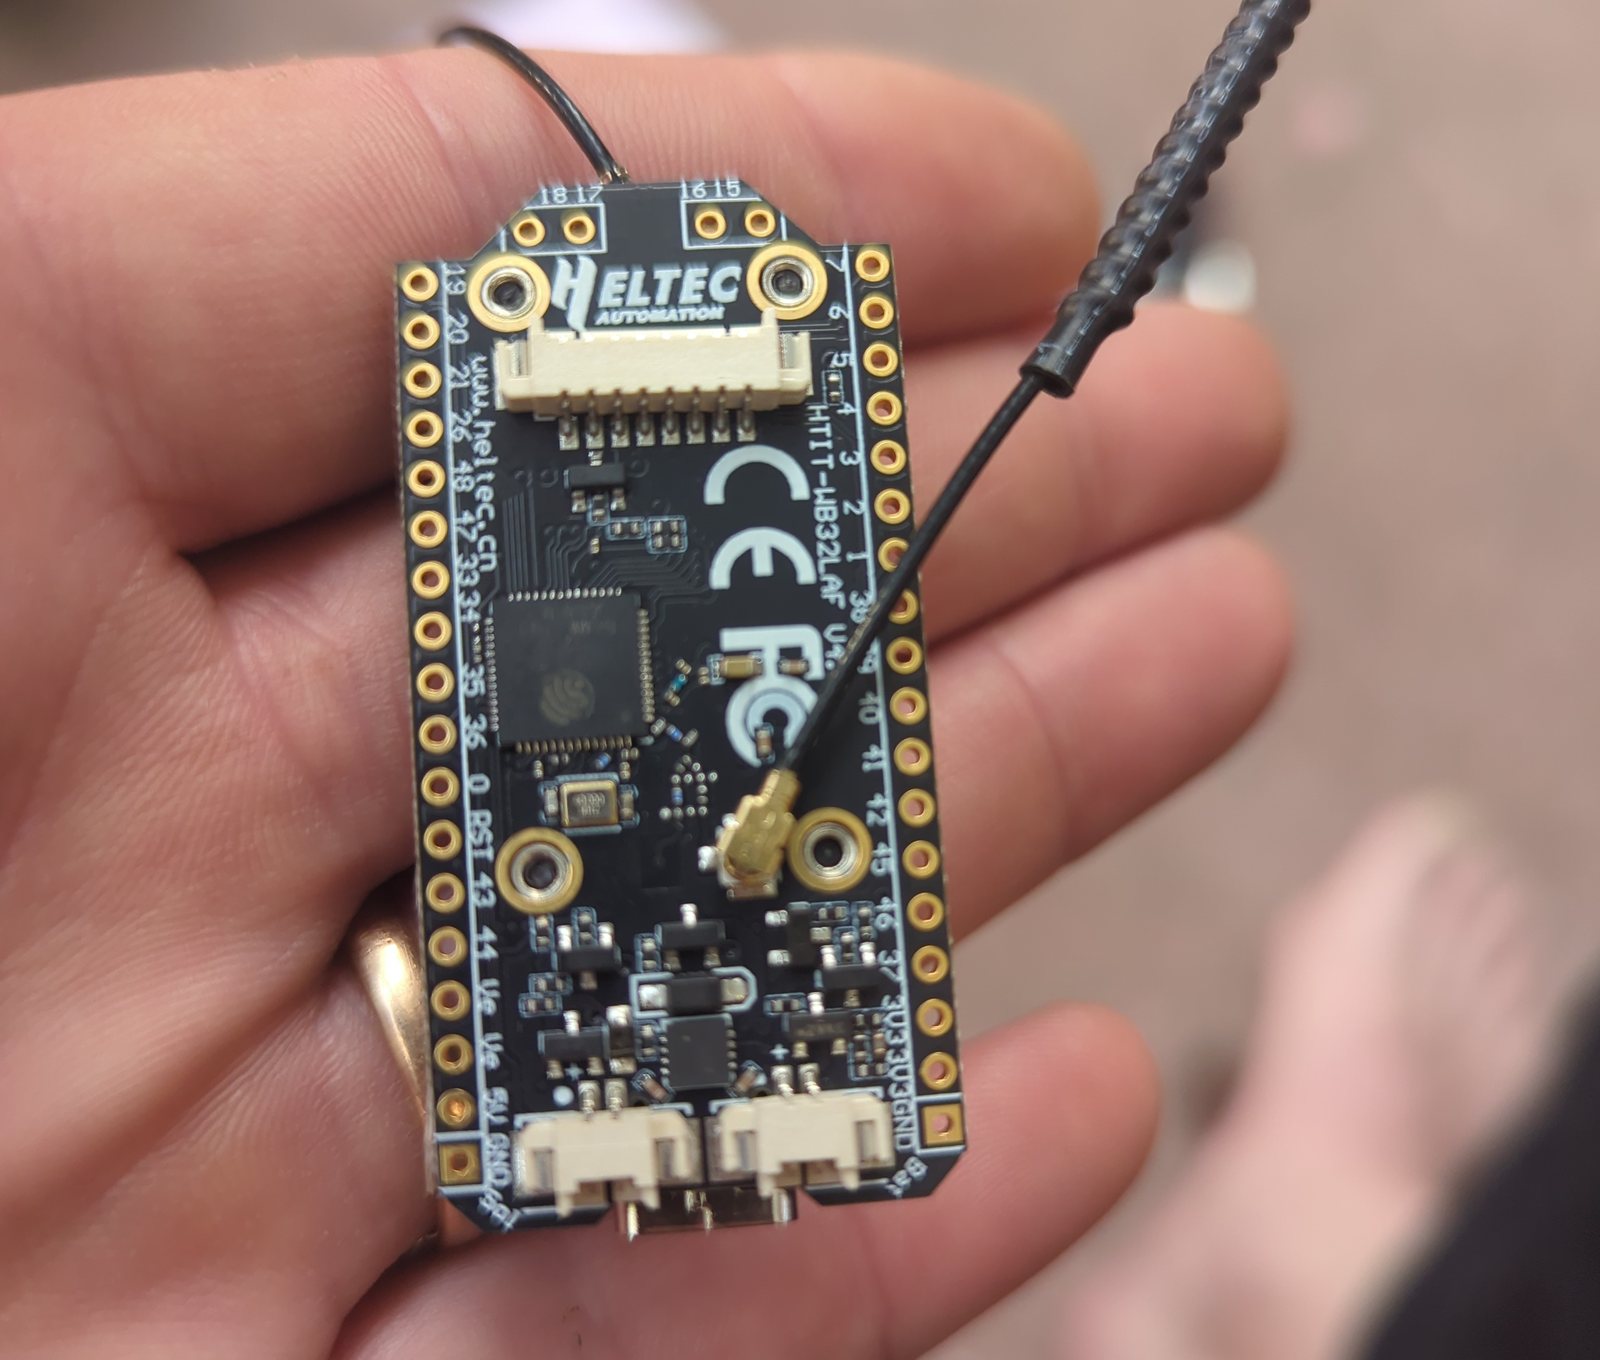
Getting four wires onto the right four holes took longer than writing the
firmware. The manufacturer’s diagram shows the front of the board; the holes are
labelled on the back; and one early message called them “pin 17 and pin 15”,
which are positions along the row and also happen to be numbers printed on four
unrelated pads. The numbers printed next to the holes are the ones the code
uses. The hole between the two sonar wires is the amplifier control pin from the
previous section, so it stays empty.
First power-up: every one of nine pings came back as a pulse of exactly 35.2
milliseconds. That is the module’s own “I heard nothing” timeout, which was
good news in disguise. It proved the board was powered, triggering and replying
at 3.3 volts. It just had nothing in front of it. Pointed at a wall, it returned
nine good pings out of nine.
Two modes came out of the bench testing. TEST takes a reading about once a
second, for aiming the sensor with the unit in your hand. FIELD takes one on a
schedule and sleeps in between. A button on either board flips the mode, and the
base station can change the schedule from the bottom of the hill, because every
answer it sends back up carries the settings.
On the hill
The sensor went onto the tank 3.7 feet above the water.
The display said 3.7 feet.
The tank rules are deliberately blunt. A reading of one foot or less is FULL.
Seven feet or more, or no echo at all, is EMPTY. A sensor that produces no pulse
whatsoever is a FAULT, because “no echo means empty” would otherwise turn an
unplugged cable into an empty tank. Three 2,500 gallon tanks in parallel make
7,500 gallons, which works out to 1,250 gallons per foot of water.
Deep sleep had never run before the unit was on the hill, so it got a staged
test from below: one-minute readings first. HILL slept and woke itself three
times, 63, 63 and 59 seconds apart. Then ten minutes, and the next reading
arrived 597 seconds later.
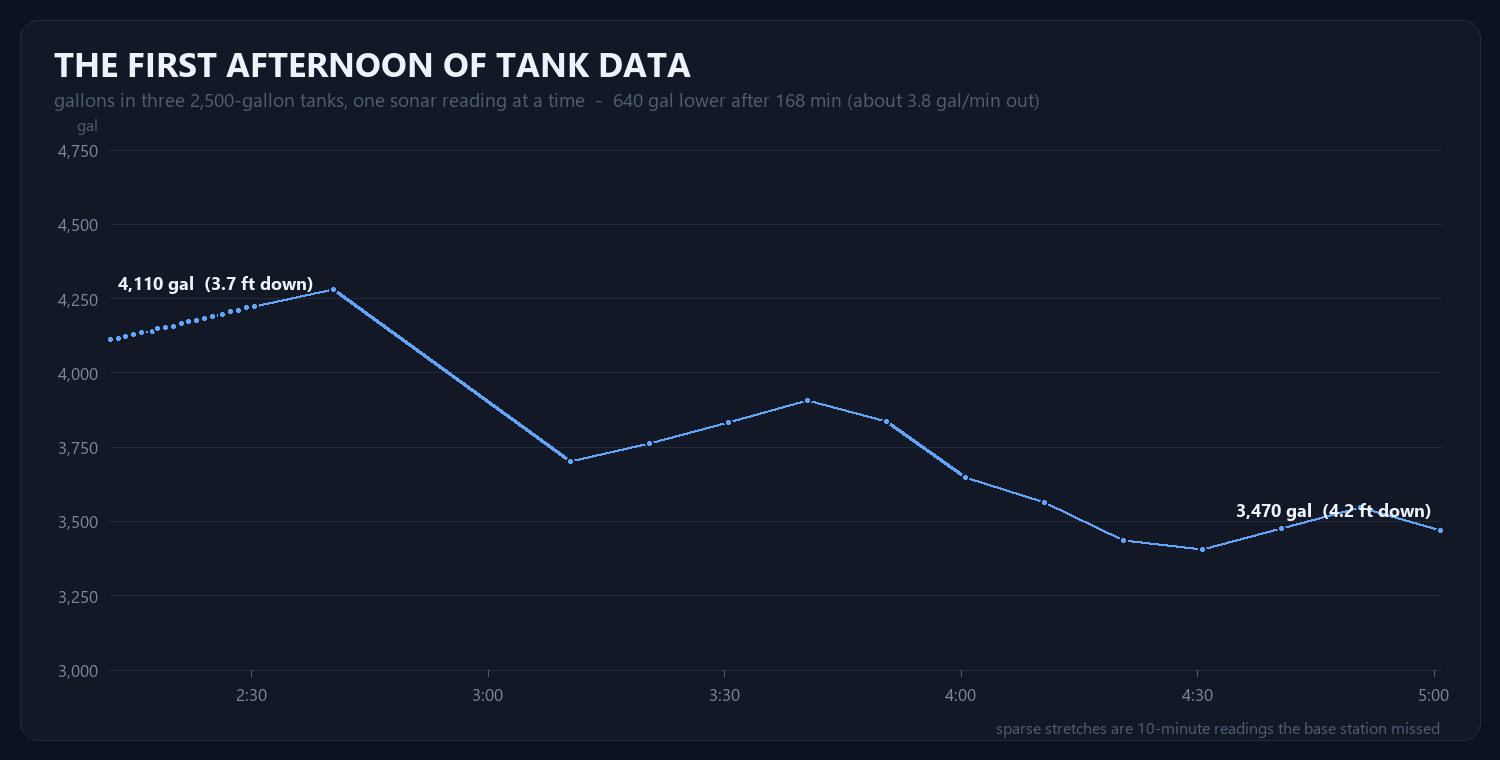
The fill and drain rate is the slope of a straight line through the last 45
minutes of readings. The sonar is good to about a centimetre, which here is
about 40 gallons, so at one reading every ten minutes the rate is honest to
roughly one gallon per minute and anything smaller is shown as “steady”.
Where to put the base station is still not solved. Next to the solar
equipment it heard the hill well but had poor WiFi, and something in that room
puts bursts of radio noise on its receiver. On a roof nearer the access point
the WiFi was fine and the radio was at the edge of what it can decode. On top of
the generator, about the same. A tall antenna for the base station is the next
experiment.
The Victron on a wire
The battery monitor’s hub, a Victron Cerbo, had been reaching the internet
over weak WiFi. That afternoon the wall showed its data as 3,668 seconds old.
Most of that hour was real: the hub had been off the cloud for most of two and a
half hours.
An Ethernet switch, a WiFi extender used as a bridge, and one cable to the
hub fixed the path. Then one switch on the hub’s own screen:
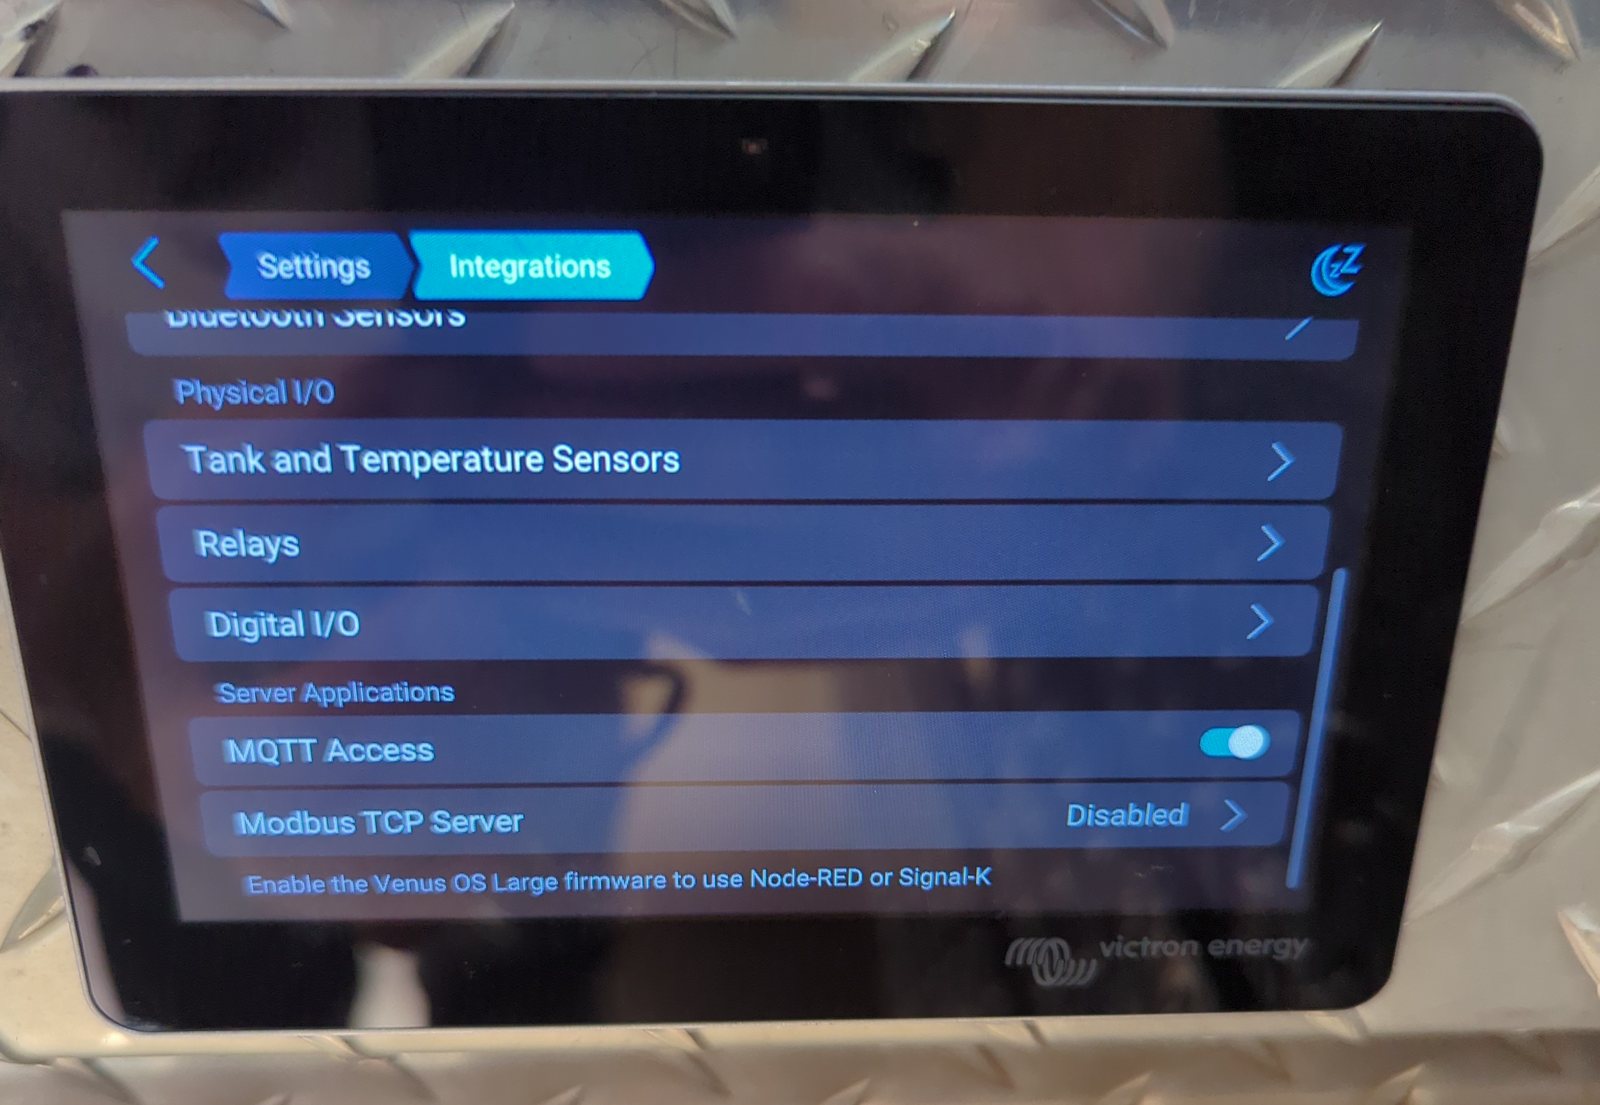
The hub wanted a password before it would hand out data, which took two
attempts to get right. Once it accepted one, the numbers were not subtle. The
first value arrived 0.6 seconds after connecting, where the cloud feed took
anywhere from five seconds to a minute. Updates come once a second. A ping to
the hub over the wire takes 0.4 milliseconds; over its WiFi a few minutes earlier it took
429.
The wall display grows up
With live data arriving, the cards stopped being good enough. The brief for
the 27 inch touchscreen was one paragraph: it should look like a picture. Solar
panels at the top. The two inverters in the middle. The battery on the left. The
load on the right, drawn as a water pump. And coming off the pump, the tanks,
with blue water at the real level.
First cut, 3:37 in the afternoon:
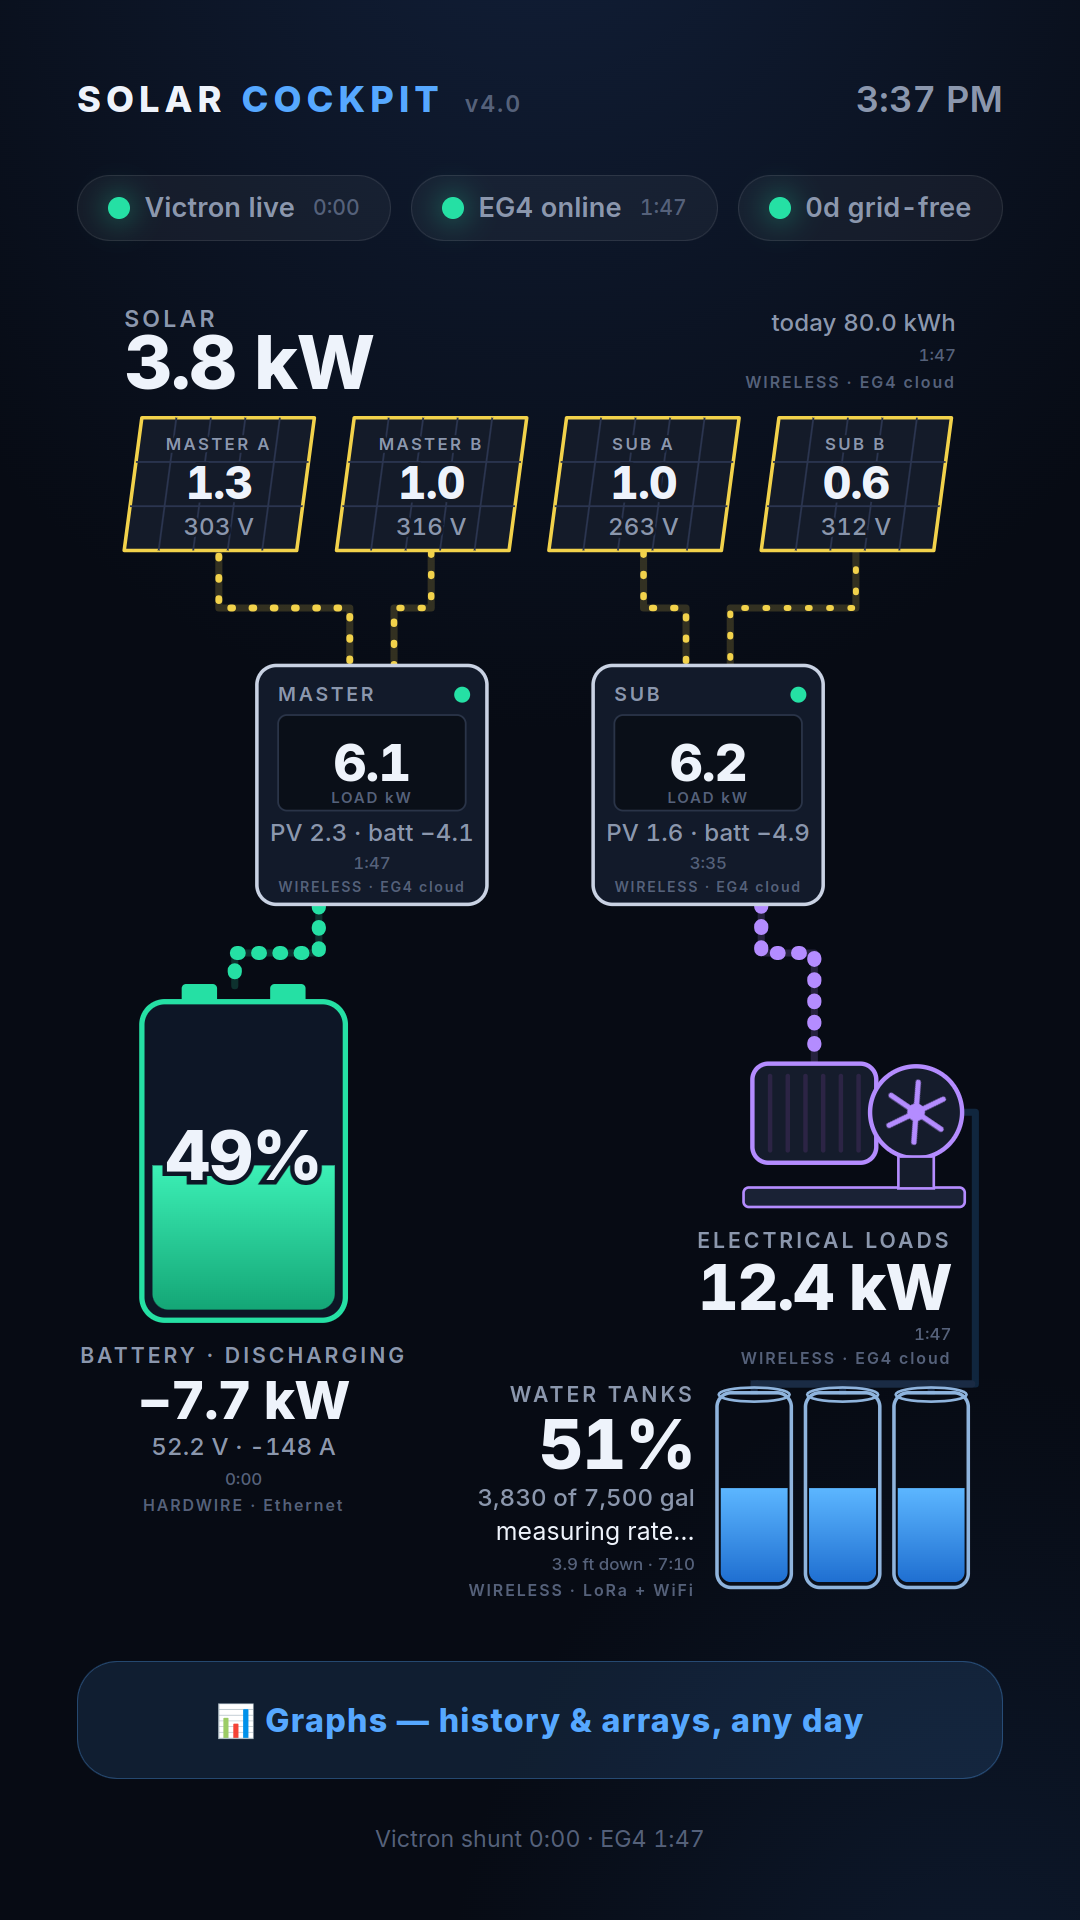
Good, and wrong in two ways that two of us spotted independently. The battery’s wire hung off one inverter and the pump’s wire off
the other, as if one charged and the other pumped. Both do both. And the battery
was green while it was draining.
Second round, 21 minutes later:
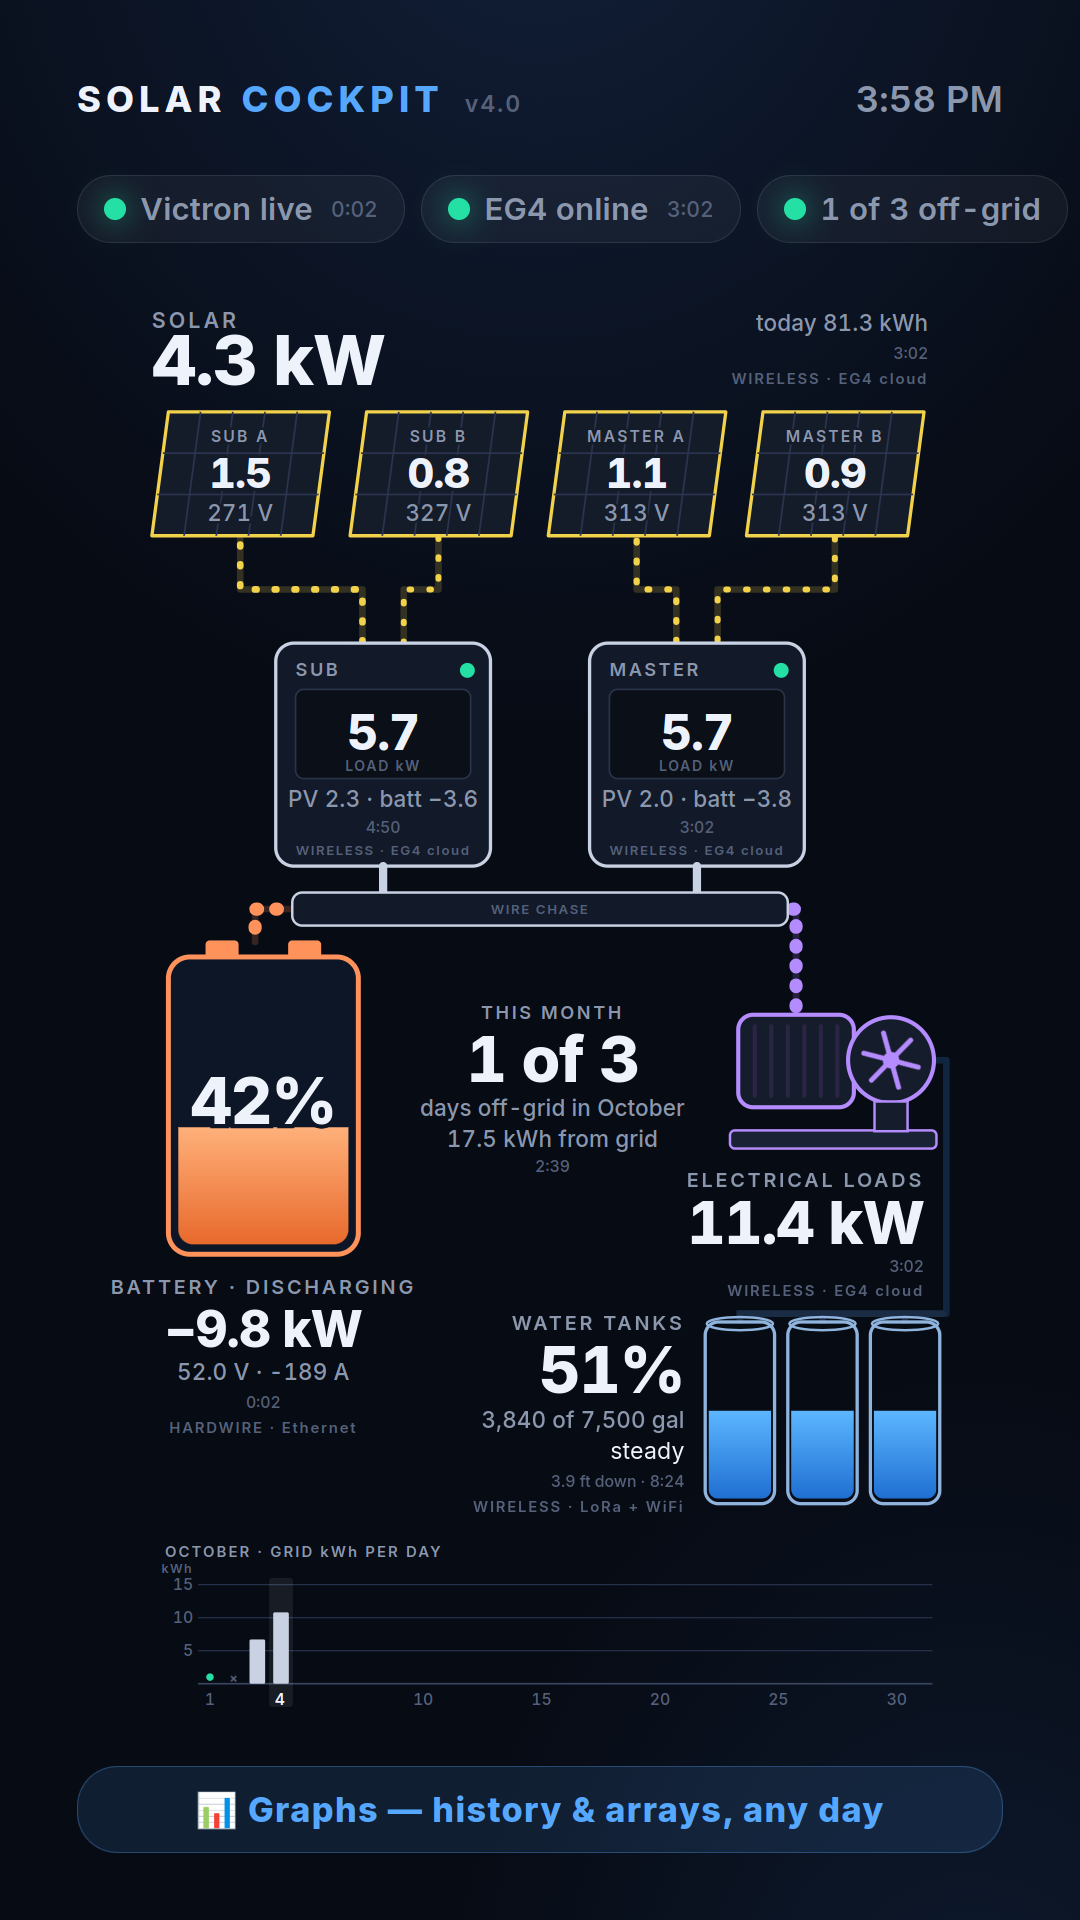
The inverters swapped sides to match the real wall. A wire chase appeared
underneath them, because there is one, six feet long, and that is where the
wires actually go. The battery turned orange while discharging; it is green when
charging and red only when it is genuinely low, so red still means something.
And the “days off the grid” counter was replaced with a month of daily bars in
the style of a utility bill.
That counter deserves a paragraph. The old screen had claimed a 21 day
streak. Part of that streak was a day when the inverters reported nothing at
all, which the old code had read as “zero grid use”. The new chart has a third
state for exactly that: a day with almost no solar recorded is marked as no
data, not as a win.
Third round, eight minutes after that:
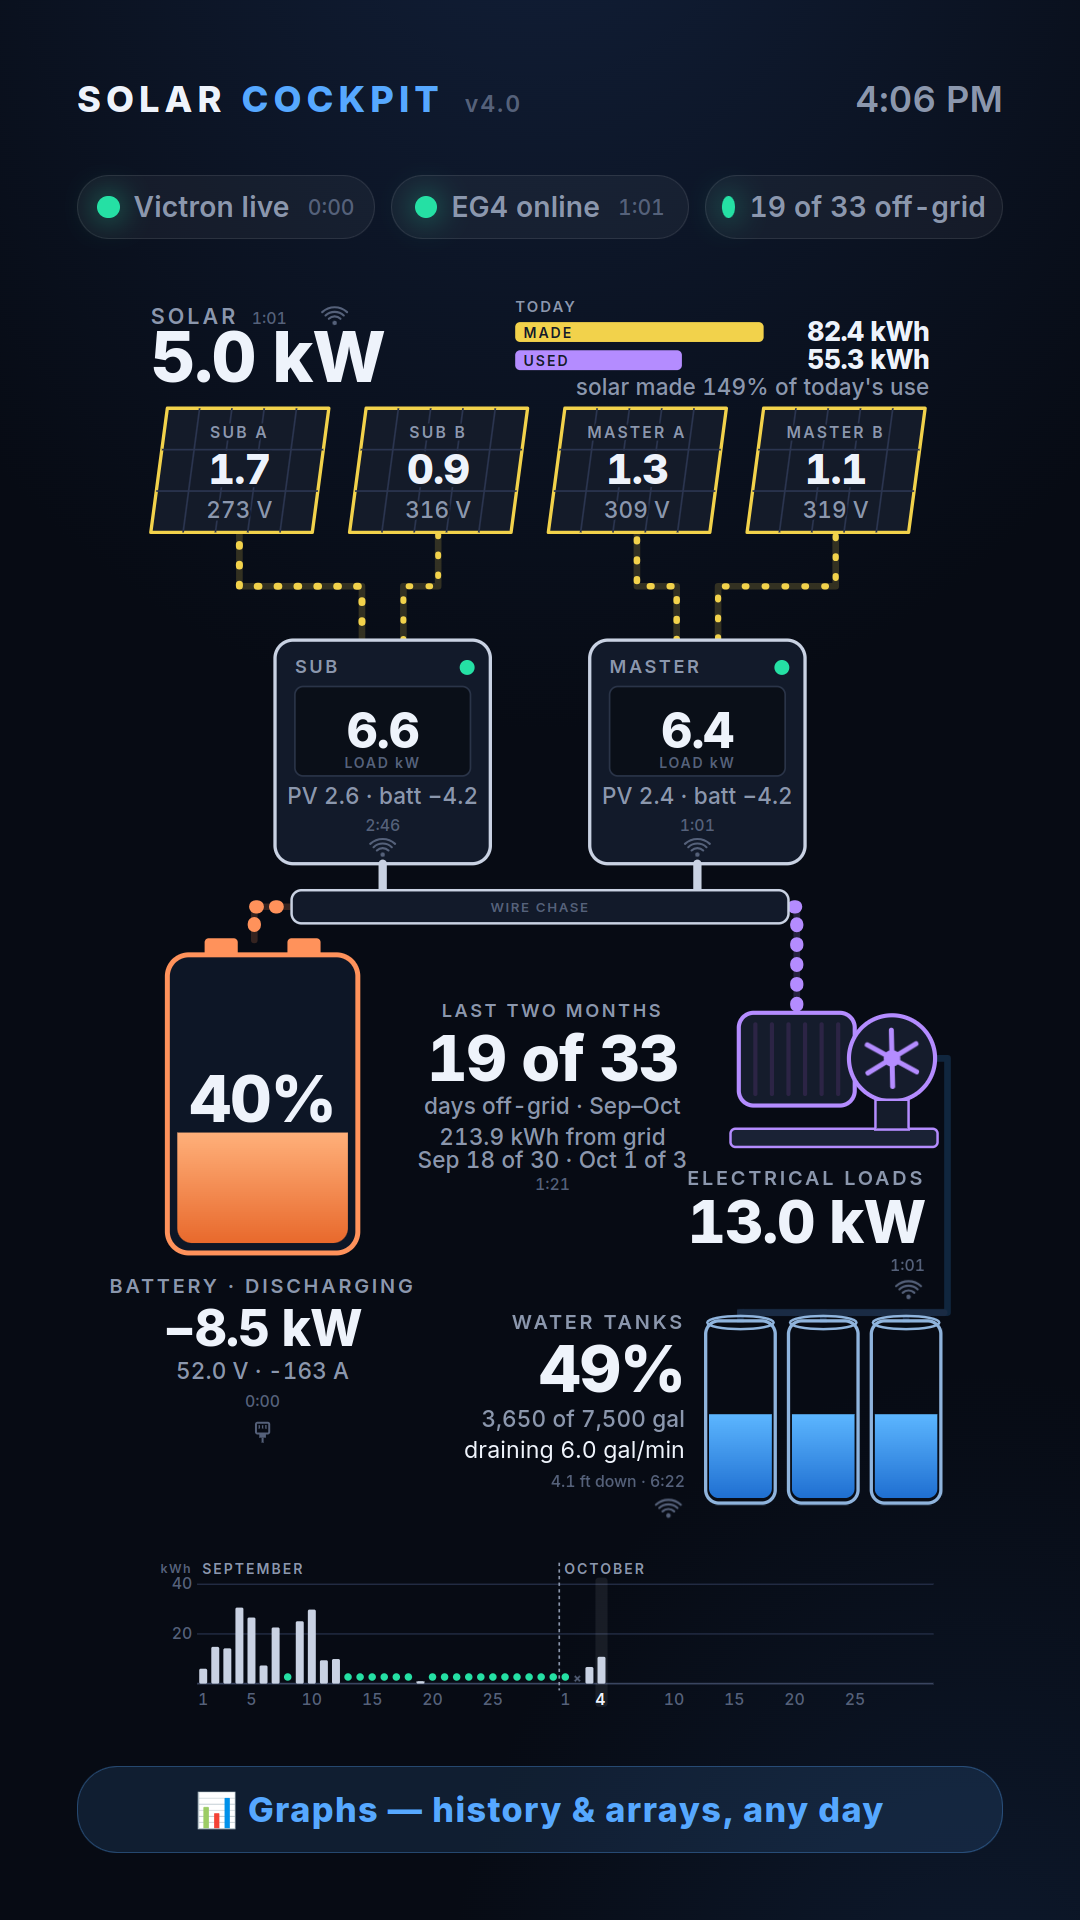
Two months along the bottom. Today’s energy at the top, made against used.
And the words “hardwire” and “wireless” replaced by a tiny plug and a tiny WiFi
symbol on each part, driven by the path the data is really taking. They are
small on purpose. One person in the family wants to know which parts are on a
wire. Another just wants to see the water.
A few rules settled along the way and are now permanent. Every number shows
its age in minutes and seconds. A reading that stops arriving is never blanked;
the last good value stays up with its timer running. And a total is never built
from half the system: if one inverter is silent, the total shows dashes and says
why.
At this point the version was set to 4.20 and pinned there. By instruction,
it stays 4.20 forever.
The inverters: two wires, wrong way round
Last job of the day. Each inverter has an RS485 port that normally feeds its
WiFi dongle. Pull the dongle, plug in a cable, and the inverter will answer
questions directly, about once a second instead of every couple of minutes.
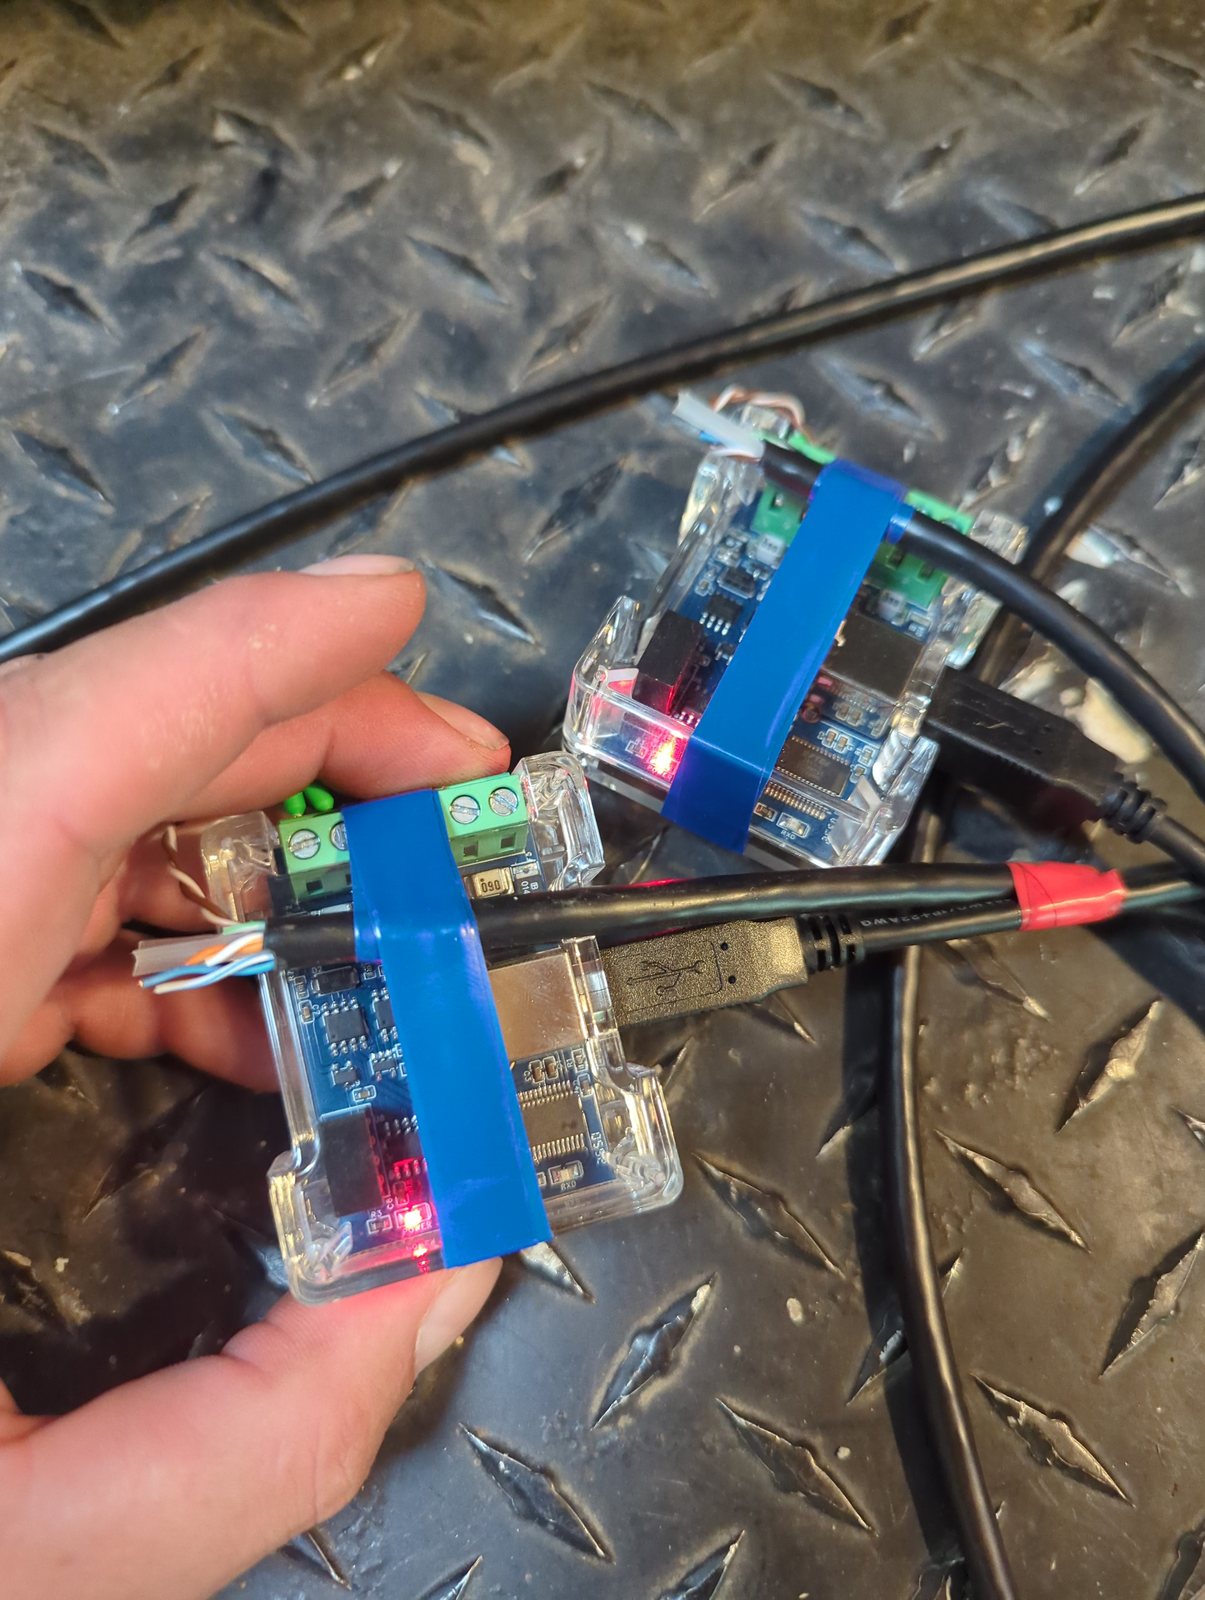
Two USB adapters, two cut-down network cables, brown and white-brown on the
screw terminals exactly as the guides on the internet show. Both dongles came
out. The wall went grey on the inverter side, as it should.
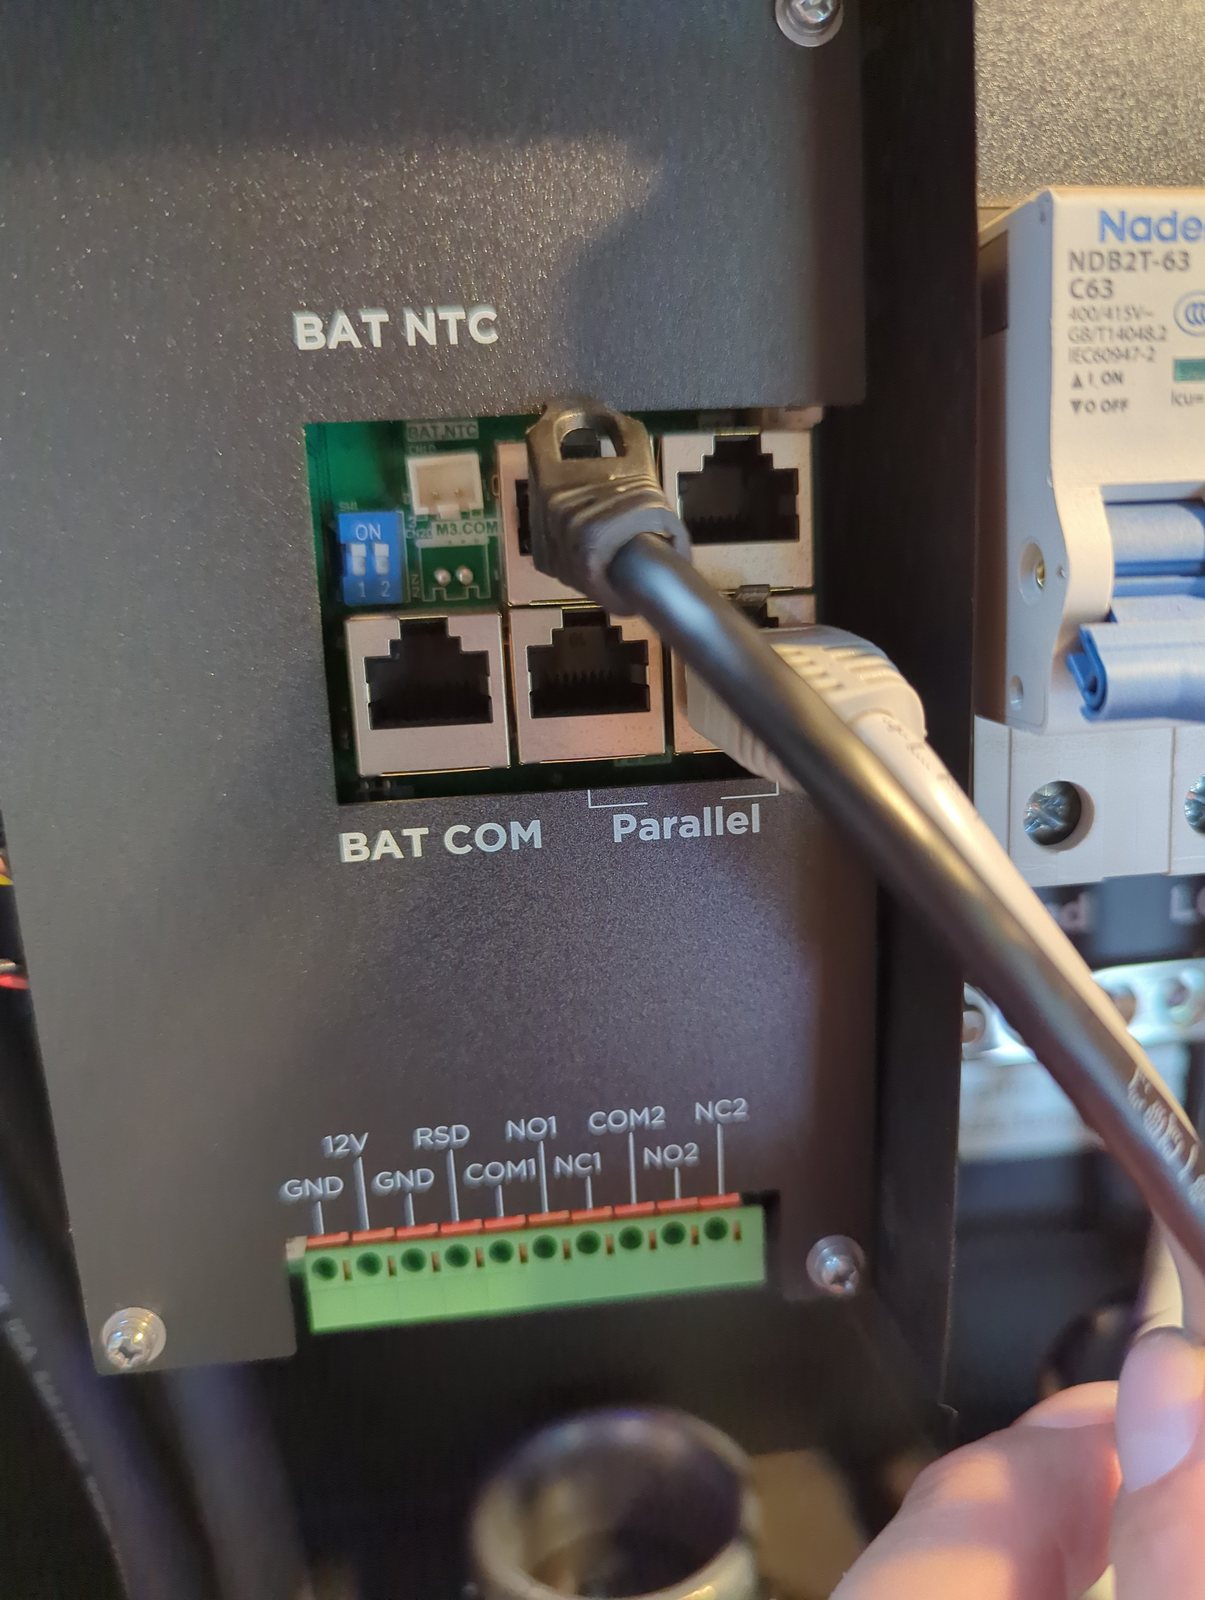
And then nothing. Read-only requests at three speeds and two addresses, on
both cables: zero bytes back. Not garbage, not errors. Silence.
Silence is a clue. A wrong speed gives you garbage. Silence means the
inverter is not hearing the question at all. The socket was right (the upper
left of the two unlabelled ones at the top). The settings were right (19200
baud, address 1, confirmed afterwards against two independent sources). That
left the two wires.
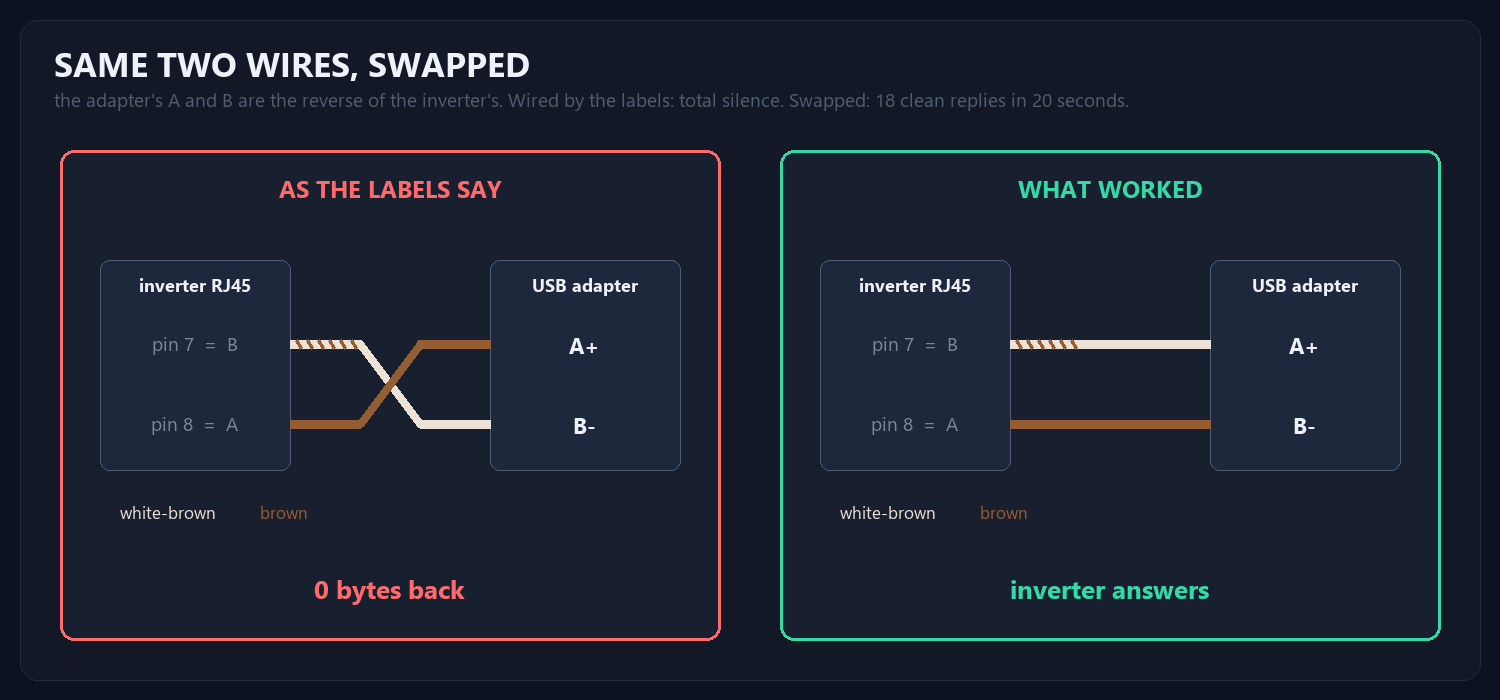
The inverter calls pin 7 “B” and pin 8 “A”. The adapter also has terminals
called A and B. They are not the same A and B. Swapping brown and white-brown
on one adapter turned twenty requests into eighteen clean replies: battery 52.4
volts, one solar string at 239 volts and 762 watts, the other at 342 volts and
906 watts, output at 239.0 volts and 59.91 hertz. The inverter also reported
its own serial number, which is how each cable is now pinned to the right
box.
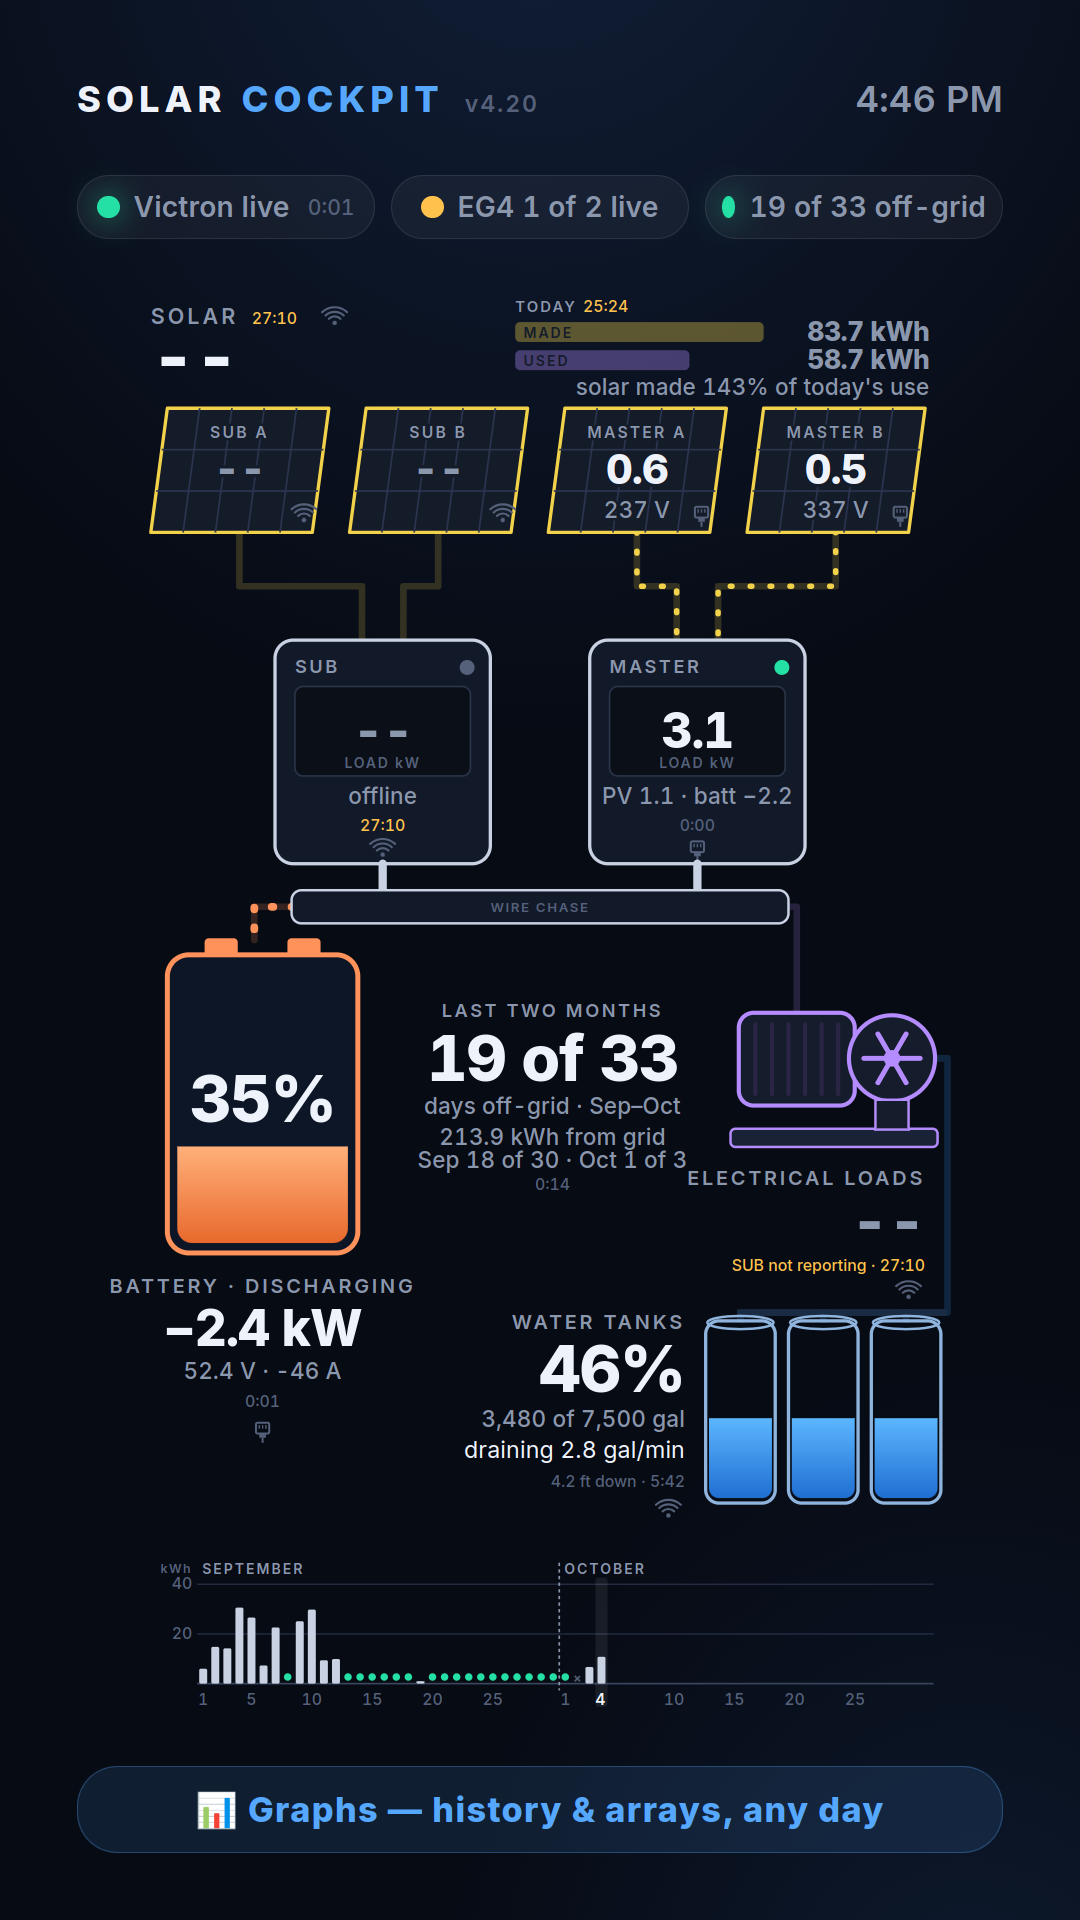
One inverter on the wire, the other still dark, and the totals showing dashes
rather than half the truth. One detail from that first frame: the inverter
believed the battery was at 81 percent while the shunt said 35. The dashboard
ignores the inverter’s opinion and always has.
The second pair of wires got swapped, and at five o’clock:
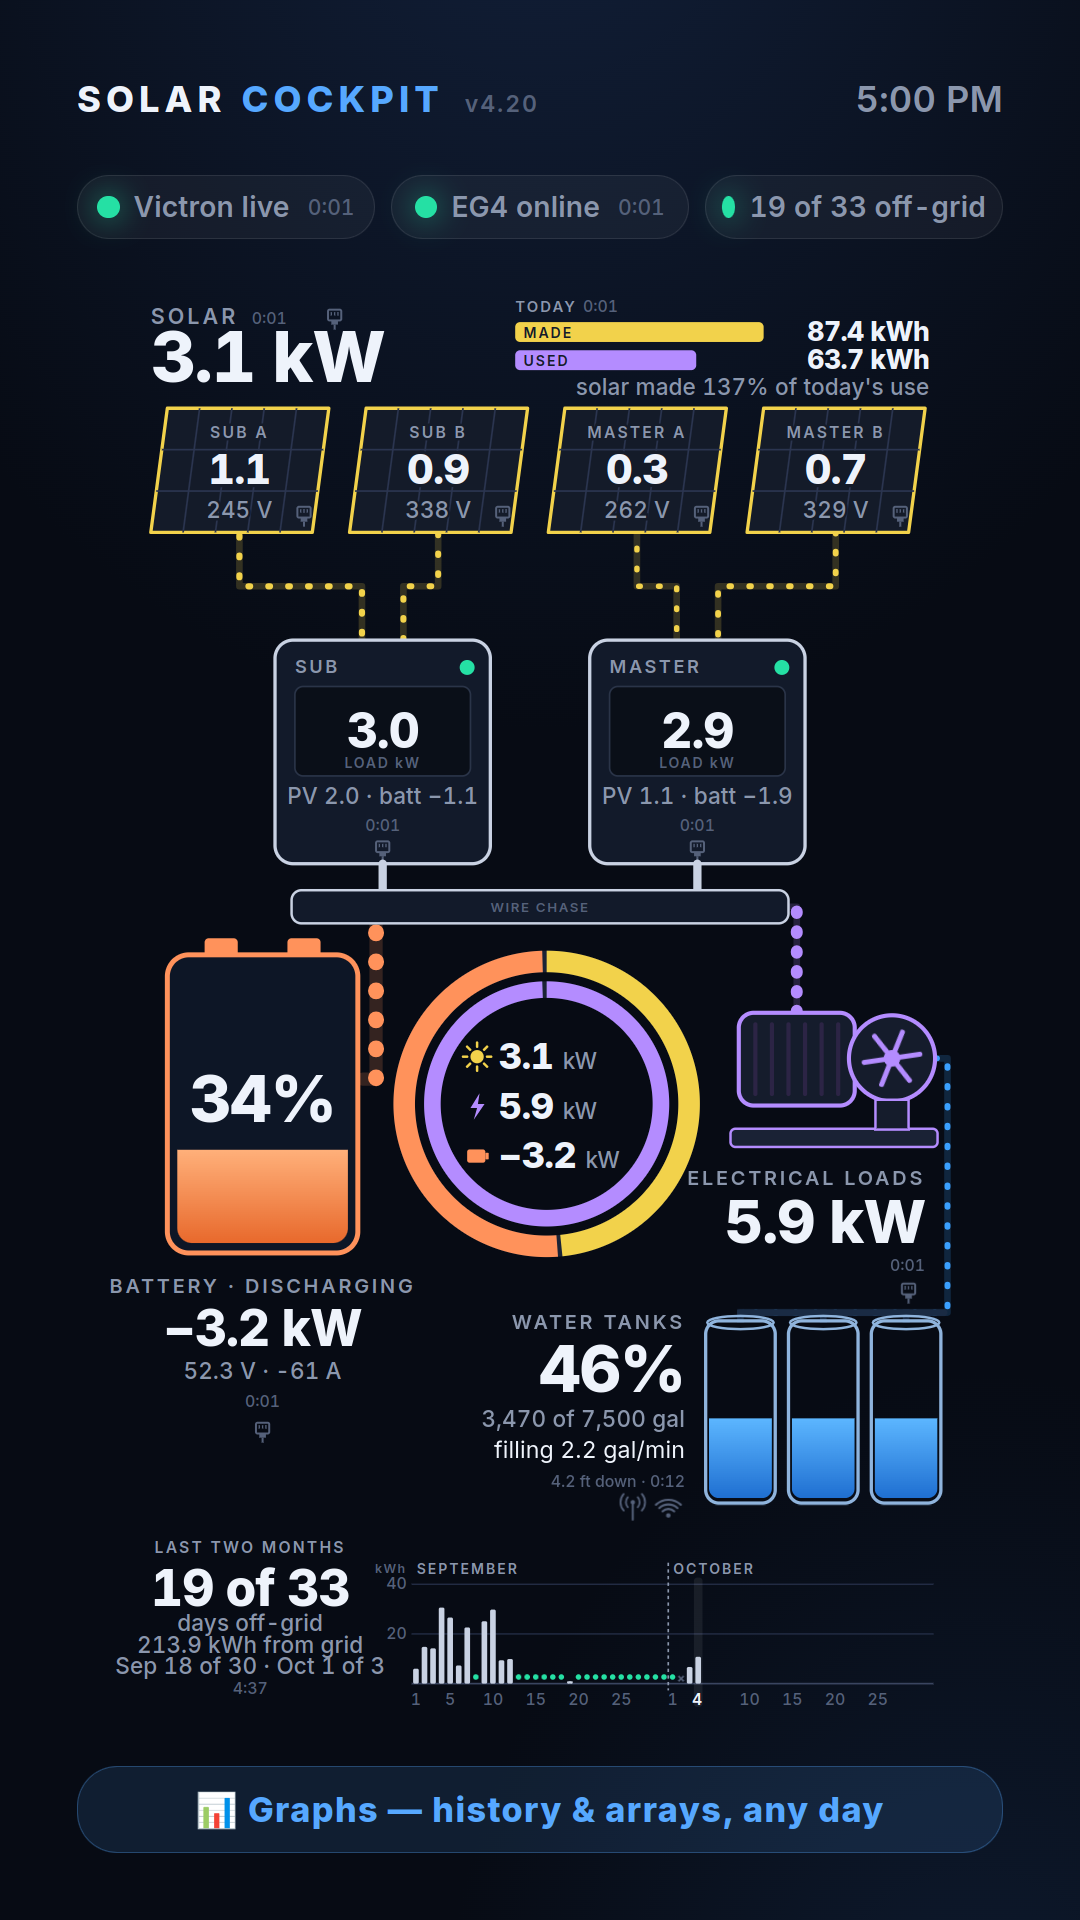
Everything in the solar room on a wire. Plugs on every part of the picture
except the tanks, which get an antenna, because they really are half a mile
away by radio. The ring in the middle is the newest piece: solar coming in, load
going out, and the difference on the battery, the three numbers that matter,
in one place.
What bit us, in order
- A log buffer that froze a radio when nobody was reading it.
- An amplifier pin that differs between two revisions of the same board, and
cost 40 dB. - Hole numbers that mean one thing in a table and another on the board.
- A sonar “reading” that was really a timeout.
- A base station that can have good WiFi or good radio, and so far not
both. - An extender that quietly became its own network when it lost its
signal. - A hub that wanted a password nobody remembered setting.
- An off-grid streak inflated by a day with no data.
- Two terminals labelled A and B that meant B and A.
What is left
The base station needs a better antenna or a better home. The hill unit
should retry when a reading goes unanswered, and its first transmission after
waking arrives weaker than it should. Each part of the picture is getting its
own page when you touch it: one big graphic for the person who wants graphics,
and a full page of numbers underneath for the person who wants numbers, with a
HOME button that says HOME. And the phone app is moving off the vendor clouds
onto the laptop in the solar room.
The version number, though, is finished.