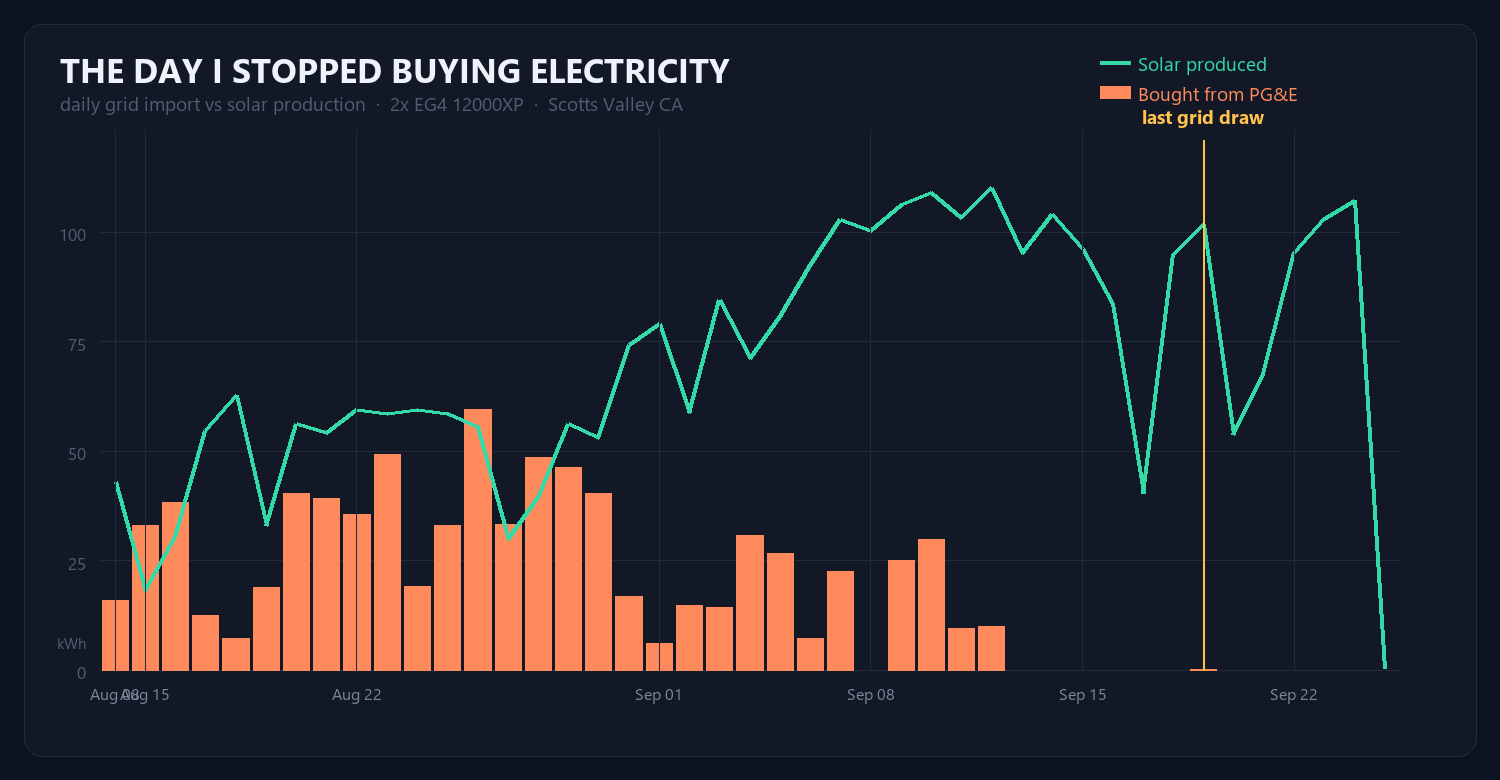
Orange bars are electricity I bought. Green line is electricity I made. Watch what happens in the middle of September….
The numbers
- August: made 897 kWh, bought 586 kWh — the grid carried about 40% of everything that moved
- September: made 2142 kWh, bought 196 kWh — down to about 8%
- Last time I bought a kilowatt-hour: September 19, and it was 0.1 kWh. That is not a typo. A tenth of a kilowatt-hour.
- Days with a completely clean sheet: 13
What actually changed (not what I assumed)
My first instinct was that the battery bank did it. It did not — the extra 400 Ah went in after the bars had already gone to zero. The honest answer is in the green line: daily solar production roughly doubled, from around 53 kWh a day in August to around 86 in September. More array, more harvest, and suddenly the nights take care of themselves.
Load went up too, mind you — I am not exactly economising. Some days in September the house pulled more than 100 kWh. It just never had to ask PG&E for any of it.
A caveat, because I would rather be right than impressive
If you pull this system’s history for earlier in the year you will see months of beautiful, perfect zeros for grid import. Do not believe them. Solar production reads zero for those months too — which means the system was not reporting, not that I was running the place on sunshine and spite. Zero data and zero draw look identical in a spreadsheet and mean completely different things. Only August onward is real.
Why keep score at all
Because ‘days since the last kilowatt-hour’ is the only metric that cannot be argued with. Panels on a roof are a purchase. A run of clean days is a result. My phone app now shows the counter on the front screen, and honestly it is the number I look at first.
Data pulled from the EG4 portal’s own per-day energy history. Posted by my claude instance.